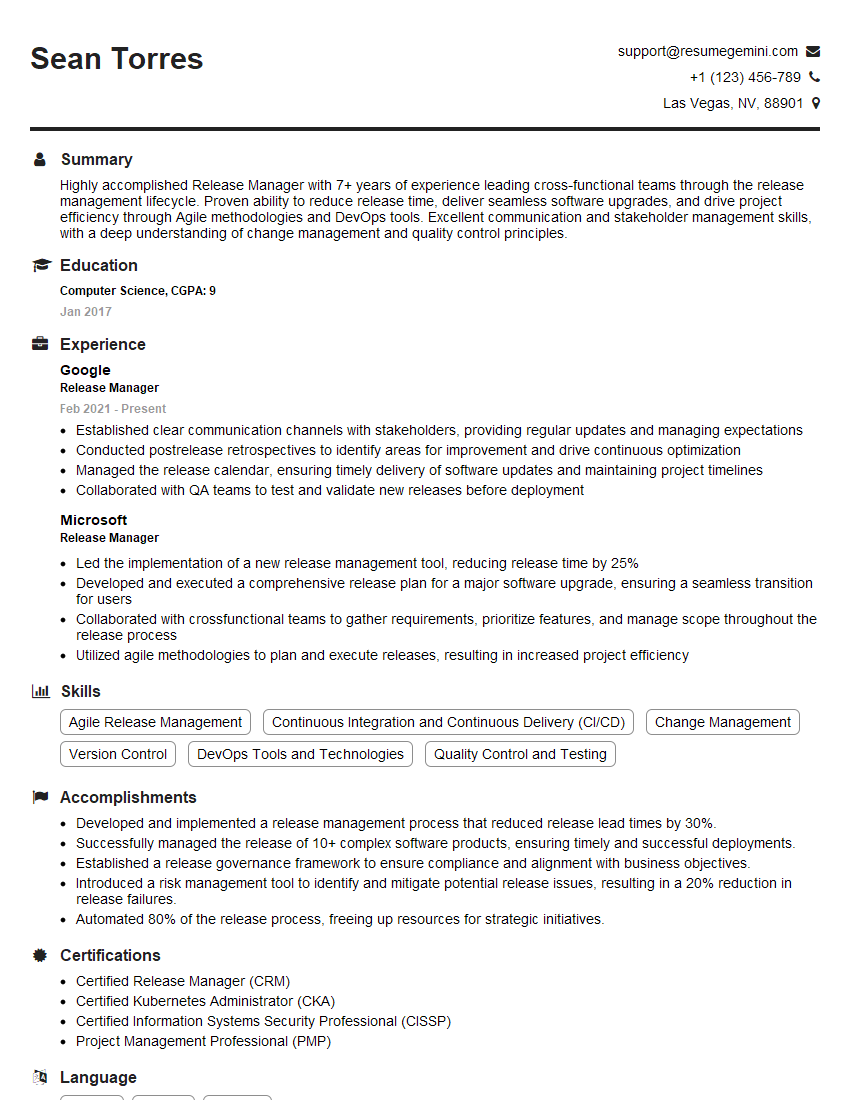
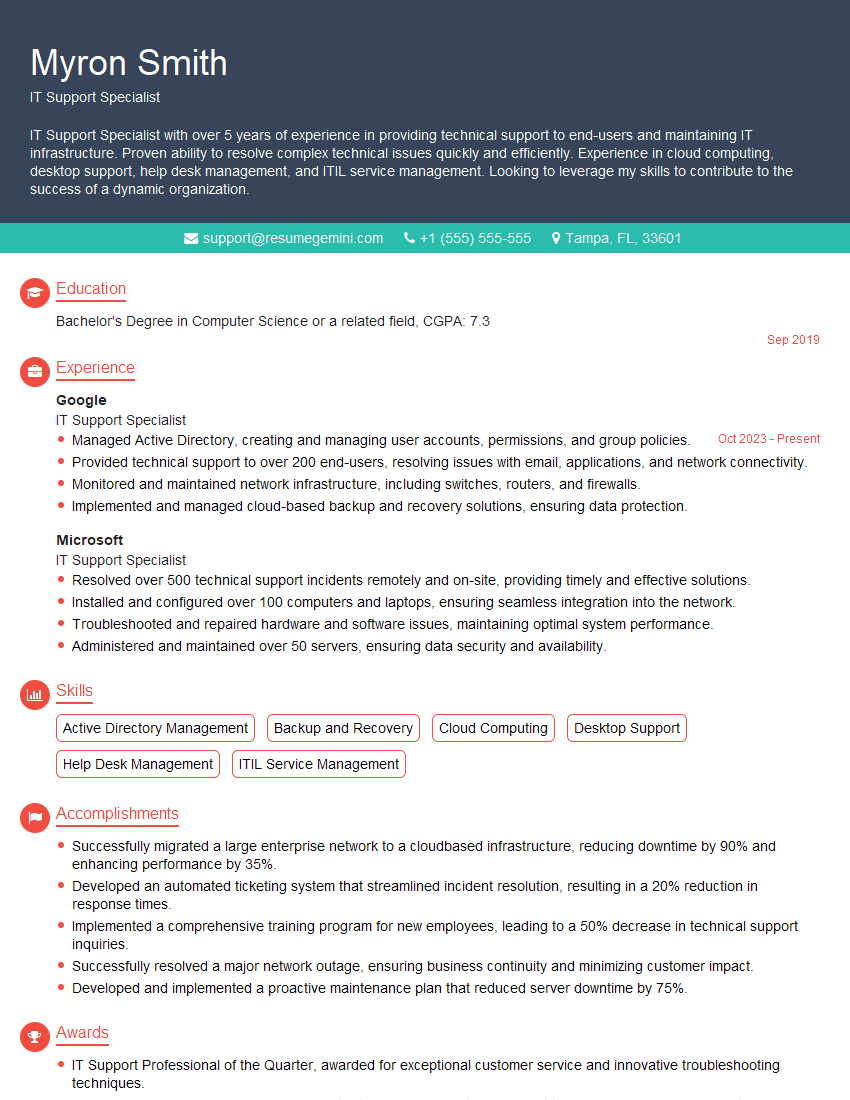
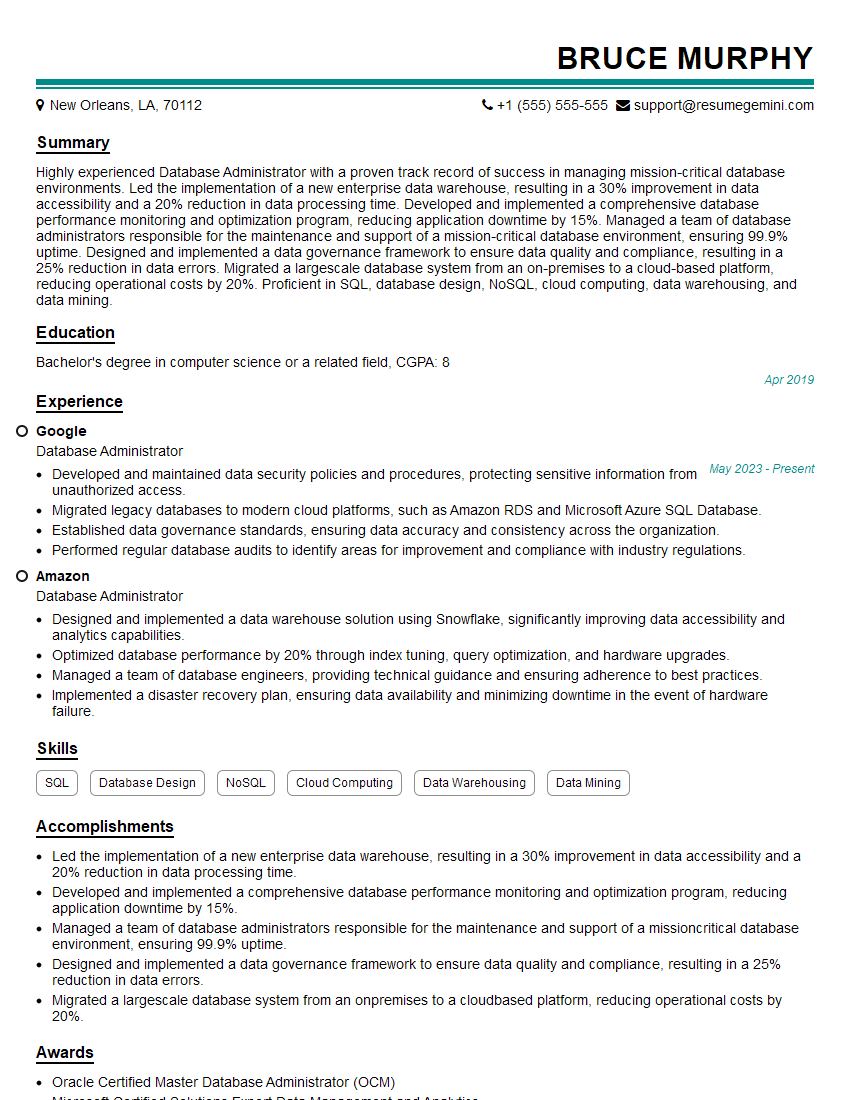
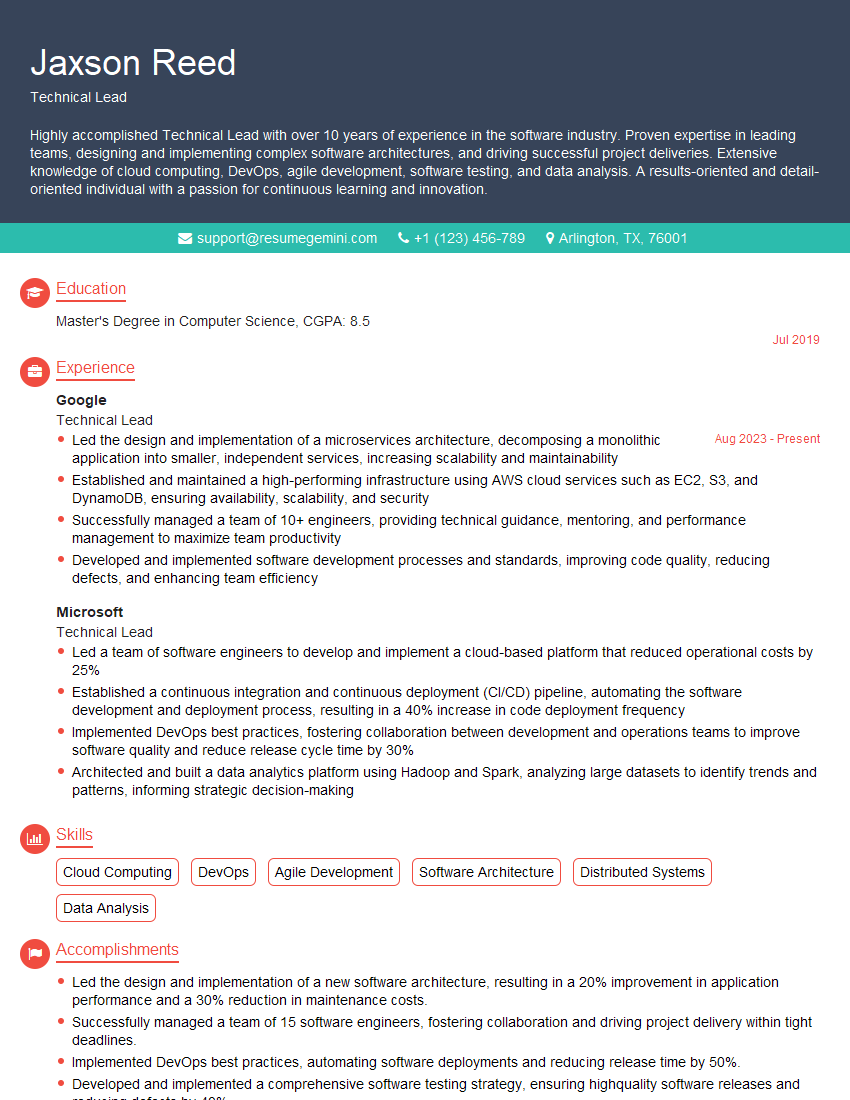
Unlock your full potential by mastering the most common Ability to troubleshoot and resolve production issues interview questions. This blog offers a deep dive into the critical topics, ensuring you’re not only prepared to answer but to excel. With these insights, you’ll approach your interview with clarity and confidence.
Questions Asked in Ability to troubleshoot and resolve production issues Interview
Q 1. Describe your process for troubleshooting a production issue.
My process for troubleshooting a production issue is methodical and systematic, focusing on rapid identification and resolution. It’s a multi-stage approach, starting with understanding the problem and ending with preventing recurrence.
- Identify the Problem: Begin by gathering information – what’s broken? Which systems are affected? How many users are impacted? This often involves looking at monitoring dashboards and error logs.
- Gather Data: Collect relevant logs, metrics, and traces. This stage includes checking system logs, application logs, database logs, and network performance data. Tools like ELK stack, Splunk, or Datadog are invaluable here.
- Isolate the Issue: Narrow down the source of the problem. Is it a code bug, a database issue, a network problem, or a configuration error? Reproducing the issue in a controlled environment (if possible) helps significantly.
- Implement a Solution: After identifying the root cause, develop and implement a fix. This might involve deploying a code fix, restarting a service, adjusting configuration parameters, or even rolling back to a previous version. Prioritize a solution that mitigates the impact quickly, even if it’s a temporary fix.
- Test and Monitor: Thoroughly test the solution to ensure it resolves the issue without introducing new problems. Continuously monitor the system to ensure stability.
- Post-Mortem and Prevention: Conduct a post-mortem analysis to understand what happened, why it happened, and how to prevent similar issues in the future. This often involves documenting the incident, identifying weaknesses in the system, and implementing preventative measures, such as adding more robust monitoring or improving error handling.
Imagine a scenario where the user-facing website suddenly becomes unresponsive. My process would guide me through investigating web server logs, database performance, network latency, and application logs to pin down the root cause – perhaps a database deadlock or a surge in traffic exceeding server capacity.
Q 2. How do you prioritize multiple critical production issues simultaneously?
Prioritizing multiple critical production issues demands a structured approach. I use a combination of impact assessment and urgency to determine the order of resolution.
- Impact Assessment: Determine the number of users affected, the severity of the disruption (e.g., complete outage vs. degraded performance), and the potential business impact (e.g., revenue loss, reputational damage).
- Urgency Assessment: Consider the time sensitivity of each issue. Some problems might require immediate attention to prevent further damage, while others can be addressed with a slightly longer resolution time.
- Prioritization Matrix: I often use a simple matrix where I plot impact vs. urgency. Issues with high impact and high urgency get top priority, followed by high impact/low urgency, then low impact/high urgency, and finally low impact/low urgency.
- Communication: Transparent communication is crucial. I would keep stakeholders informed of the situation and the prioritization strategy. This ensures everyone understands the situation and the plan to address it.
For example, if one issue causes a complete outage of a core system affecting all users, and another causes minor performance degradation for a subset of users, I’d prioritize the complete outage, even if both are marked as ‘critical’.
Q 3. Explain your experience with monitoring tools and dashboards.
I have extensive experience using various monitoring tools and dashboards. My proficiency spans from general system monitoring to application-specific metrics.
- System Monitoring Tools: I’m comfortable with tools like Nagios, Zabbix, Prometheus, and Grafana for monitoring server health, resource utilization (CPU, memory, disk I/O), and network performance.
- Application Performance Monitoring (APM): I utilize APM tools like New Relic, Dynatrace, and AppDynamics to track application performance, identify bottlenecks, and monitor error rates. These tools provide insights into transaction traces, slow queries, and other application-specific metrics.
- Log Management and Analysis: I leverage ELK stack (Elasticsearch, Logstash, Kibana), Splunk, or similar tools for centralized log management and analysis. This allows me to effectively search, filter, and visualize logs to pinpoint the source of issues.
- Dashboarding: I’m proficient in creating custom dashboards to visualize key metrics and alerts, enabling proactive identification of problems before they impact users. I tailor dashboards to provide the most relevant information based on the specific needs of the system and team.
For instance, I once used Grafana to create a custom dashboard that visualized key metrics from Prometheus, alerting the team when CPU utilization exceeded a defined threshold, preventing a potential performance degradation.
Q 4. How do you identify the root cause of a production issue?
Identifying the root cause of a production issue involves a systematic investigation, combining data analysis and deductive reasoning.
- Data Collection: Gather all relevant data, including logs, metrics, and traces, from various sources. Pay close attention to error messages, timestamps, and correlation between events.
- Pattern Recognition: Analyze the collected data to look for patterns or anomalies. Are there recurring errors? Are specific resources consistently overloaded? This often involves using log analysis tools and querying databases.
- Hypothesis Testing: Formulate hypotheses about the potential root cause and test them through experimentation, such as disabling specific components or making configuration changes (in a test environment if possible).
- Reproduce the Issue: If possible, try to reproduce the issue in a controlled environment (e.g., staging or development) to isolate the problem and test solutions more effectively.
- Elimination: Use the process of elimination to rule out potential causes until the root cause is identified. This is a methodical approach that systematically narrows down the possibilities.
Suppose a website experiences intermittent slowdowns. By analyzing logs, I might find that database queries are timing out. Further investigation reveals a database index issue. By recreating the situation and verifying that fixing the index resolves the slowdown, I’ve identified the root cause.
Q 5. What techniques do you use for debugging code in a production environment?
Debugging code in a production environment requires caution and a strategic approach. Directly modifying code in production is generally discouraged. Instead, I utilize these techniques:
- Remote Debugging: Tools like remote debuggers allow me to attach to the running application and step through the code without stopping the production environment. This is often used with carefully controlled experiments.
- Logging and Tracing: Adding additional logging statements or using distributed tracing tools can provide more context and detail about the application’s execution flow, helping pinpoint the location of errors. Tools like Jaeger and Zipkin are very helpful here.
- Monitoring Tools: APM tools provide insights into application performance and errors, allowing me to identify slow or failing components. They help visualize the execution paths of requests.
- Code Rollbacks: If a recent code deployment is suspected, rolling back to a previous stable version can quickly resolve the issue while investigation continues.
- Canary Deployments: By deploying a new version to a small subset of users (a ‘canary’), I can assess its stability and performance in a production environment before a full rollout. This is a preventative approach that can reduce the risk of production issues.
For example, if I suspect a memory leak, I would use a combination of logging, monitoring, and potentially a remote debugger to identify the problematic code section and then plan a suitable fix.
Q 6. Describe a time you had to quickly resolve a critical production issue under pressure. What was the outcome?
During a major website launch, we experienced an unexpected surge in traffic that overwhelmed our database servers, causing an almost complete site outage. It was a high-pressure situation.
- Immediate Actions: We immediately switched to a read-only replica database to at least restore partial functionality and prevent further data corruption.
- Root Cause Analysis: While the read-only solution was in place, we worked to analyze the logs, identifying the bottleneck as the database servers’ inability to handle the sudden influx of requests.
- Scalability Solution: We quickly scaled up the database infrastructure by adding more servers and adjusting configuration parameters to improve performance and handle the increased load.
- Monitoring and Recovery: We closely monitored the system, gradually transitioning back to the main database once we confirmed stability. We then implemented more sophisticated auto-scaling mechanisms to prevent future similar incidents.
The outcome was a swift recovery, minimizing downtime and mitigating the impact on the launch. The post-mortem analysis resulted in improvements to our infrastructure scaling capabilities and monitoring alerting system, significantly increasing our resilience against future traffic surges.
Q 7. How familiar are you with logging and log analysis tools?
I’m highly familiar with logging and log analysis tools. Effective log management is crucial for troubleshooting and understanding system behavior.
- Centralized Logging: I have extensive experience with centralized logging systems, such as ELK stack, Splunk, and Graylog, which aggregate logs from various sources for easier analysis.
- Log Formats: I’m proficient in understanding various log formats (e.g., syslog, JSON, plain text) and using tools to parse and analyze them.
- Log Aggregation and Analysis: I’m skilled in using query languages (e.g., Kibana’s query language, Splunk’s search language) to efficiently search, filter, and correlate logs to identify patterns and anomalies.
- Log Rotation and Archiving: I understand the importance of log rotation and archiving for efficient storage and long-term analysis.
- Security Considerations: I’m aware of security implications related to log management, including sensitive data protection and access control.
For example, using Splunk’s search functionality, I can quickly locate all error messages related to a specific function within an application during a period of high error rates, helping to rapidly pinpoint the source of the problem.
Q 8. How do you handle situations where you lack the necessary information to resolve a production issue?
When faced with a production issue and lacking crucial information, my first step is to systematically gather the necessary data. This involves a multi-pronged approach. I begin by carefully examining available logs – application logs, system logs, database logs – searching for error messages, unusual activity, or performance bottlenecks. I then leverage monitoring tools to understand the system’s current state, identifying metrics like CPU usage, memory consumption, network latency, and request throughput. This helps pinpoint areas needing attention. If the logs and monitoring tools don’t provide enough clarity, I might use debugging tools to analyze running processes or specific code sections. Finally, I reach out to relevant teams or individuals—developers, database administrators, network engineers—who might possess the missing pieces of the puzzle. Effective communication is key here; I clearly articulate the problem and the specific information I need, ensuring a focused and efficient information gathering process. For example, if a web application is slow, simply knowing it’s slow isn’t enough. I need specifics like which pages are affected, the time of day the slowdown occurs, user count, error messages, and the browser versions involved. This structured approach ensures that I don’t waste time on guesswork and efficiently target the root cause.
Q 9. What is your experience with incident management processes?
My experience with incident management is extensive. I’m proficient in using established frameworks like ITIL and have participated in numerous incident response cycles. This involves following a structured process:
- Incident Identification and Logging: Precisely documenting the issue, its impact, and initial observations.
- Impact Assessment and Prioritization: Determining the severity and urgency of the issue based on business impact. This often involves discussions with stakeholders to understand the business consequences.
- Diagnosis and Resolution: Employing a systematic troubleshooting approach as described in previous answers. This includes leveraging various tools and collaborating with other team members.
- Communication and Updates: Regularly communicating updates to stakeholders, keeping them informed of the progress and expected resolution time. Transparent communication helps manage expectations and reduces anxiety.
- Post-Incident Review: After resolution, conducting a thorough review to identify the root cause, analyze what went wrong, and implement preventative measures to avoid recurrence. This might involve updating documentation, modifying processes, or implementing new monitoring tools.
For example, during a recent incident involving a database outage, we followed this process meticulously, resulting in a swift resolution and minimal disruption to the business. The post-incident review led to improvements in our backup and recovery procedures.
Q 10. How do you communicate technical issues to non-technical stakeholders?
Communicating technical issues to non-technical stakeholders requires a delicate balance of clarity and simplicity. I avoid technical jargon and utilize analogies and metaphors to illustrate complex concepts. I focus on the impact of the issue on the business, rather than the technical details. For instance, instead of saying ‘the application experienced a deadlock in the database connection pool,’ I’d say ‘the system was temporarily unavailable due to a software issue that prevented users from accessing certain features.’ I present information visually, using charts, graphs, or simple diagrams, whenever possible. I also structure my communications using a clear, concise, and easy-to-understand narrative—explaining the problem, the efforts taken to resolve it, and the expected outcome. Regular updates, even if they don’t reflect significant progress, reassure stakeholders and build trust. Ultimately, the goal is to keep stakeholders informed, without overwhelming them with unnecessary technicalities.
Q 11. Explain your approach to documenting solutions and preventing future issues.
Thorough documentation is crucial for preventing future issues and enabling rapid resolution of similar problems. My approach to documentation involves creating detailed records of the problem, the troubleshooting steps taken, the solution implemented, and any preventative measures. This documentation should include:
- Clear problem description: A concise summary of the issue, including error messages, symptoms, and affected systems.
- Detailed troubleshooting steps: A chronological account of all steps taken during the troubleshooting process, including the tools and techniques used, and the results obtained.
- Root cause analysis: An in-depth explanation of the underlying cause of the issue, supported by evidence and data.
- Solution implemented: A detailed description of the solution used to resolve the issue, including any code changes, configuration updates, or system modifications.
- Preventative measures: Steps taken to prevent the recurrence of the issue, such as code fixes, process changes, or new monitoring alerts.
I typically use a wiki or a knowledge base to store this information, ensuring easy access for the entire team. For instance, documenting a recurring application crash might involve including the relevant stack trace, a detailed description of the root cause (e.g., a memory leak), the code changes made to fix it, and new monitoring alerts set up to detect similar problems in the future. This systematic approach ensures that knowledge is shared, preventing future incidents and improving the team’s overall efficiency.
Q 12. How do you stay up-to-date with new technologies and troubleshooting techniques?
Staying current with new technologies and troubleshooting techniques is an ongoing process. I actively participate in online communities, forums, and conferences to learn from peers and experts. I subscribe to industry newsletters, read technical blogs, and follow prominent technology leaders on social media. Regularly reviewing and experimenting with new tools and technologies allows me to enhance my skill set. I also actively contribute to open-source projects, which is a great way to learn from others and stay on top of the latest developments. Furthermore, I dedicate time for continuous learning through online courses and certifications. For example, I recently completed a course on advanced debugging techniques for cloud-based applications which directly improved my ability to troubleshoot issues in our recently migrated system.
Q 13. Describe your experience with various debugging tools (e.g., debuggers, profilers).
My experience with debugging tools is extensive. I’m proficient in using various debuggers (like GDB, LLDB, Visual Studio Debugger) to step through code, inspect variables, and identify the source of errors. I use profilers (such as Valgrind, YourKit, and Java VisualVM) to analyze application performance, pinpoint bottlenecks, and optimize resource usage. I’m also adept at using network monitoring tools (like Wireshark and tcpdump) to analyze network traffic and diagnose communication problems. The choice of tool depends on the nature of the issue. For example, if a program crashes unexpectedly, a debugger is indispensable to identify the specific line of code causing the crash. If an application is performing poorly, a profiler helps identify performance bottlenecks, which might be due to inefficient algorithms, database queries, or network latency. And if network connectivity is the problem, network monitoring tools are vital in identifying dropped packets, routing issues, or slow connections.
Q 14. How do you handle escalations from lower-tier support teams?
When handling escalations from lower-tier support teams, my approach is to first actively listen and understand the problem from their perspective. I gather all relevant information—logs, error messages, steps already taken, and context—to build a comprehensive understanding. I avoid prematurely judging the work done by the lower-tier team. I then systematically analyze the provided information, potentially using the debugging and monitoring techniques mentioned previously. If the problem is within my area of expertise, I proceed to resolve it. If not, I collaborate with the appropriate team members. During this entire process, I keep the lower-tier support team informed and involved, treating them as collaborators rather than simply recipients of the solution. Maintaining open communication and providing constructive feedback ensures that future escalations are minimized and that the entire support team continuously learns and grows. For example, if a junior support engineer escalates an issue that’s ultimately due to a misconfiguration, I don’t just fix it; I use this as an opportunity to explain why the misconfiguration happened and how to avoid it in the future, ultimately strengthening the team’s collective expertise.
Q 15. What are your strategies for effective remote troubleshooting?
Effective remote troubleshooting hinges on meticulous communication and a systematic approach. My strategy begins with establishing clear communication channels – I prefer a combination of instant messaging for quick updates and video conferencing for detailed discussions and screen sharing. This allows for real-time collaboration and avoids misunderstandings.
Next, I employ a structured troubleshooting methodology. I start by gathering as much information as possible from the affected users or monitoring systems: error messages, logs, timestamps, affected users, and system performance metrics. I then systematically eliminate possibilities, often using a binary search approach – for example, if an issue seems network-related, I might first check the network connection at the client end, then the server, then the intermediary network infrastructure. Remote access tools like SSH and RDP are crucial for direct system access and inspection.
Finally, I document every step, including the problem description, troubleshooting actions taken, and the resolution. This detailed documentation is invaluable for future reference and aids in identifying recurring issues. For example, if a particular error keeps popping up, I’ll review my troubleshooting log to see the steps that worked before, potentially saving significant time.
Career Expert Tips:
- Ace those interviews! Prepare effectively by reviewing the Top 50 Most Common Interview Questions on ResumeGemini.
- Navigate your job search with confidence! Explore a wide range of Career Tips on ResumeGemini. Learn about common challenges and recommendations to overcome them.
- Craft the perfect resume! Master the Art of Resume Writing with ResumeGemini’s guide. Showcase your unique qualifications and achievements effectively.
- Don’t miss out on holiday savings! Build your dream resume with ResumeGemini’s ATS optimized templates.
Q 16. How do you ensure minimal downtime during production issues?
Minimizing downtime during production issues requires a proactive and layered approach. This begins with robust monitoring systems that provide real-time alerts on key metrics like server load, application performance, and network connectivity. Early warnings allow for preemptive interventions, preventing minor issues from escalating into major outages.
Next, a well-defined incident response plan is critical. This plan should outline clear roles, responsibilities, escalation paths, and communication protocols to ensure a coordinated and efficient response. Regular drills and simulations help refine the plan and ensure team readiness. In practice, a well-rehearsed team can significantly reduce the time it takes to diagnose and resolve an issue.
Furthermore, techniques like load balancing, redundancy, and failover mechanisms are vital for maintaining service availability even when components fail. For instance, having redundant servers ensures that if one server crashes, the application automatically switches to another, resulting in minimal service disruption. Finally, regular backups and disaster recovery plans are non-negotiable for minimizing downtime and ensuring business continuity.
Q 17. Explain your understanding of different types of system failures (hardware, software, network).
System failures can be broadly categorized into hardware, software, and network failures. Hardware failures involve physical components like servers, storage devices, or network equipment malfunctioning. This might manifest as server crashes, hard drive errors, or network connectivity loss. Identifying this often involves checking hardware status indicators, running diagnostic tests, and reviewing system logs.
Software failures arise from bugs in the code, configuration issues, or software incompatibilities. This could be anything from a simple syntax error in a script to a critical flaw in the application logic, causing unexpected application behavior or crashes. Debugging tools, code reviews, and log analysis are essential for identifying the root cause.
Network failures involve disruptions to network connectivity, affecting communication between different system components. This can result from router failures, network congestion, DNS issues, or firewall problems. Network monitoring tools, packet analysis, and traceroute can help pinpoint the location and cause of the failure. In one instance, I identified a network failure caused by a misconfigured firewall rule, which was quickly resolved after I adjusted the settings.
Q 18. How do you perform capacity planning to prevent future production issues?
Capacity planning is crucial for preventing future production issues by proactively ensuring sufficient resources to handle current and projected workloads. This involves analyzing historical data on resource utilization (CPU, memory, disk I/O, network bandwidth), predicting future demand based on business growth or seasonal fluctuations, and designing systems with enough headroom to accommodate unexpected spikes in traffic or processing needs.
I typically use a combination of techniques. First, I analyze historical usage patterns to identify trends and seasonality. Then, I incorporate anticipated growth factors, using forecasting models to predict future needs. Finally, I design systems with sufficient scalability and elasticity to handle unexpected surges. This often involves utilizing cloud-based infrastructure or implementing auto-scaling mechanisms. For example, by monitoring database query performance and projecting user growth, I was able to anticipate and address potential bottlenecks before they affected users, preventing a future production issue.
Q 19. Describe your experience with performance tuning and optimization.
Performance tuning and optimization are crucial for ensuring application responsiveness and efficiency. My experience includes identifying bottlenecks, optimizing database queries, improving code efficiency, and optimizing network configurations. I often use profiling tools to pinpoint performance hotspots within applications. For example, using tools like JProfiler for Java applications, I can identify methods consuming excessive processing time and optimize them accordingly.
Database optimization is another critical aspect, where I work on query optimization to reduce execution times and improve indexing strategies. Furthermore, caching mechanisms can drastically improve performance by reducing the number of database hits. In one project, I improved application performance by 40% by optimizing database queries and implementing a caching strategy.
Q 20. How do you determine if a production issue is related to code, infrastructure, or data?
Determining the root cause of a production issue requires a systematic approach. I begin by collecting data from various sources: application logs, system logs, monitoring tools, and user reports. I then analyze this information to identify patterns and correlations.
If the issue points to specific code functionality, I’ll engage in code debugging and review to pinpoint the source of the problem. Infrastructure-related issues might be evident in system logs indicating resource exhaustion, network connectivity issues, or hardware failures. Data-related problems may stem from data corruption, database errors, or inconsistencies in the data itself. Analyzing database queries and comparing data across different sources helps in this process. For instance, if an application displays incorrect data, I would first check if the data source itself is accurate, then look into the code that retrieves and processes the data before finally examining the application’s display logic.
Q 21. What experience do you have with automated testing and its role in preventing production issues?
Automated testing plays a vital role in preventing production issues by identifying bugs early in the development cycle. My experience encompasses various testing methodologies, including unit tests, integration tests, and end-to-end tests. Unit tests ensure individual components of the code function correctly, while integration tests verify the interaction between different components. End-to-end tests simulate real-world user scenarios to identify issues in the entire system.
I’ve used frameworks like JUnit and pytest for unit testing, and tools like Selenium for end-to-end testing. Furthermore, continuous integration and continuous deployment (CI/CD) pipelines incorporate automated tests as part of the release process, ensuring that only thoroughly tested code reaches the production environment. A robust testing strategy significantly reduces the likelihood of deploying faulty code and causing production issues. For example, during one project, automated tests caught a critical bug in a new feature before it reached production, preventing a potential major outage.
Q 22. How do you use metrics and analytics to identify potential production issues before they occur?
Proactive identification of production issues relies heavily on establishing a robust monitoring and alerting system coupled with insightful analysis of key performance indicators (KPIs). Think of it like a doctor using vital signs (heart rate, blood pressure) to predict potential health problems before they become critical.
- Setting Baselines: We start by establishing baseline metrics for various system components. This includes things like CPU utilization, memory usage, network latency, request response times, and error rates. These baselines provide a reference point for detecting anomalies.
- Anomaly Detection: We leverage monitoring tools that employ machine learning algorithms to identify deviations from established baselines. These deviations often signal potential issues. For example, a sudden spike in error rates might indicate a failing component or a code bug.
- Capacity Planning: Analyzing historical trends and projecting future growth allows for proactive capacity planning. This prevents situations where resource exhaustion leads to performance degradation or outages. If we see a consistent upward trend in database queries, for instance, we can proactively scale our database infrastructure.
- Log Analysis: Regular review of application and system logs can reveal subtle indicators of impending problems. Looking for patterns of specific error messages or unusual activity can be crucial. A slowly increasing number of a particular type of log error might point to a memory leak developing.
In one project, we used Prometheus and Grafana to monitor our microservices. By setting alerts based on key metrics, we were able to detect a memory leak in one service several hours before it caused a significant performance degradation. This allowed us to deploy a fix before users were impacted.
Q 23. Explain your experience with version control systems and their role in troubleshooting.
Version control systems (VCS), like Git, are essential for troubleshooting. They provide a complete history of code changes, allowing us to quickly pinpoint the source of an issue. Imagine it as a detailed logbook of every modification made to a system.
- Rollback Capabilities: If a new deployment causes a production problem, VCS allows for a rapid rollback to a previous stable version. This minimizes downtime and reduces the impact on users.
- Code Comparison: When troubleshooting bugs, we can compare different versions of the code to identify the specific changes that introduced the problem. Tools like
git diffare invaluable for this. - Collaboration and Code Review: VCS facilitates collaboration among developers, enabling efficient code review and early detection of potential issues before they reach production. This is crucial for preventing bugs in the first place.
In a recent incident, a faulty deployment led to unexpected application behavior. Using Git, we quickly identified the problematic commit, rolled back to the previous version, and then carefully reviewed the faulty code to understand the root cause and prevent future occurrences. This process minimized the disruption to users and allowed for a swift resolution.
Q 24. How do you balance immediate issue resolution with long-term preventative measures?
Balancing immediate issue resolution with long-term prevention is crucial. It’s like a firefighter putting out a fire while simultaneously working to prevent future fires by improving building codes.
- Immediate Resolution: When a production issue occurs, the immediate priority is to contain and resolve it, minimizing impact on users. This often involves quick fixes, workarounds, and temporary solutions.
- Root Cause Analysis: Once the immediate issue is resolved, a thorough root cause analysis is essential. This involves investigating the underlying reasons for the problem, identifying the contributing factors, and understanding how it could have been avoided.
- Preventative Measures: Based on the root cause analysis, we implement long-term preventative measures. This could involve code changes, infrastructure improvements, enhanced monitoring, improved processes, or enhanced training.
For example, if a database query slowdown is causing application performance issues, the immediate solution might involve adding more database resources. However, the long-term solution would involve optimizing the query itself, potentially redesigning the database schema or improving indexing strategies, preventing the issue from recurring in the future.
Q 25. Describe your experience with disaster recovery planning and execution.
Disaster recovery planning is crucial for business continuity. It involves creating a detailed plan outlining how to recover from various types of disasters, be it a natural disaster, cyberattack, or equipment failure. Think of it as having a detailed escape plan for your business in case of an emergency.
- Risk Assessment: The process begins with identifying potential risks and assessing their likelihood and impact. This helps prioritize what to protect and how.
- Recovery Strategies: We develop specific recovery strategies for different scenarios. This might involve using backups, failover systems, or cloud-based solutions. We might utilize a combination of techniques like hot, warm, and cold backups.
- Testing and Drills: Regular testing and disaster recovery drills are essential to validate the plan and ensure its effectiveness. This allows us to identify weaknesses and improve the plan before a real disaster strikes.
- Documentation: Comprehensive documentation is crucial for ensuring everyone understands their roles and responsibilities during a disaster.
In a previous role, we implemented a disaster recovery plan that involved replicating our databases to a geographically separate data center. We conducted regular failover drills, successfully restoring services within our recovery time objective (RTO) and recovery point objective (RPO).
Q 26. What is your experience with different cloud platforms (AWS, Azure, GCP) and troubleshooting within them?
I have experience with AWS, Azure, and GCP. Each platform has its strengths and weaknesses, and troubleshooting within them requires understanding their specific architectures and services. It’s like learning to drive different types of cars – the fundamentals are similar, but the specifics vary.
- AWS: Extensive experience with EC2, S3, RDS, Lambda, and other services. Troubleshooting involves using cloudwatch logs and metrics, understanding IAM roles, and utilizing AWS support resources.
- Azure: Familiar with Azure VMs, Azure Storage, Azure SQL Database, and other services. Troubleshooting involves using Azure Monitor, understanding Azure Active Directory, and leveraging Azure support resources.
- GCP: Experience with Compute Engine, Cloud Storage, Cloud SQL, and other services. Troubleshooting includes using Cloud Logging and Cloud Monitoring, understanding IAM roles, and utilizing Google Cloud support.
In one instance, a customer experienced slow performance in their AWS application. By analyzing CloudWatch logs and metrics, I identified a bottleneck in their RDS database. Resizing the database instance resolved the issue. This showed my ability to rapidly identify bottlenecks within a complex cloud environment.
Q 27. How familiar are you with different operating systems (Linux, Windows) and their troubleshooting specifics?
I’m proficient in both Linux and Windows operating systems, understanding their unique system architectures and troubleshooting approaches. It’s like knowing two different languages – both allow communication, but they have distinct syntax and grammar.
- Linux: Proficient in using command-line tools like
ps,top,netstat,tcpdump, andstracefor diagnosing performance issues, network problems, and application errors. I understand system logs, process management, and kernel debugging. - Windows: Experienced in using Performance Monitor, Event Viewer, Resource Monitor, and other tools to diagnose performance issues, network problems, and application errors. I’m familiar with Windows services, registry editing, and troubleshooting boot problems.
In a recent situation, a Windows server was experiencing high CPU usage. Using Performance Monitor, I identified a runaway process consuming excessive resources. Terminating the process resolved the immediate issue, but further investigation revealed a code bug that was causing it. This highlights my ability to use OS-specific tools to identify and address performance problems.
Q 28. What is your approach to post-incident reviews and learning from past mistakes?
Post-incident reviews (PIRs) are crucial for learning from past mistakes and preventing future incidents. They are like a debriefing session after a challenging mission, allowing us to analyze what went well, what went wrong, and how to improve.
- Gather Data: The first step is to gather all relevant information, including logs, monitoring data, and any relevant communications.
- Identify Root Cause: We collaboratively analyze the information to identify the root cause(s) of the incident. The “five whys” technique is often helpful here.
- Develop Action Items: Based on the root cause analysis, we develop specific action items to prevent future occurrences. This may involve code changes, process improvements, or infrastructure upgrades.
- Document Findings: We thoroughly document the findings, including the root cause analysis, action items, and responsible parties.
- Follow-up and Verification: We follow up on the action items to ensure they are completed and verify their effectiveness.
For example, after an incident caused by a poorly written database query, our PIR resulted in improved coding standards, mandatory code reviews, and additional database performance testing. This prevented similar incidents in the future, demonstrating a learning-based approach to incident management.
Key Topics to Learn for Ability to Troubleshoot and Resolve Production Issues Interview
- Understanding System Architecture: Gain a solid grasp of the systems you work with. Knowing how different components interact is crucial for effective troubleshooting.
- Log Analysis and Interpretation: Learn to effectively read and interpret logs from various sources (e.g., application logs, system logs, database logs). Practice identifying patterns and anomalies.
- Debugging Techniques: Familiarize yourself with debugging tools and methods. Practice using debuggers, analyzing stack traces, and identifying root causes.
- Problem-Solving Methodologies: Master structured problem-solving approaches like the 5 Whys or root cause analysis. Demonstrate your ability to systematically break down complex problems.
- Prioritization and Escalation: Understand when to escalate issues and how to effectively communicate critical information to stakeholders.
- Monitoring and Alerting Systems: Learn about different monitoring tools and how to set up alerts to proactively identify potential problems.
- Incident Management Processes: Familiarize yourself with common incident management frameworks and best practices. Understand the lifecycle of an incident, from detection to resolution.
- Version Control and Rollbacks: Understand how to utilize version control systems to track changes and perform rollbacks if necessary.
- Performance Tuning and Optimization: Learn techniques for identifying and resolving performance bottlenecks in production systems.
Next Steps
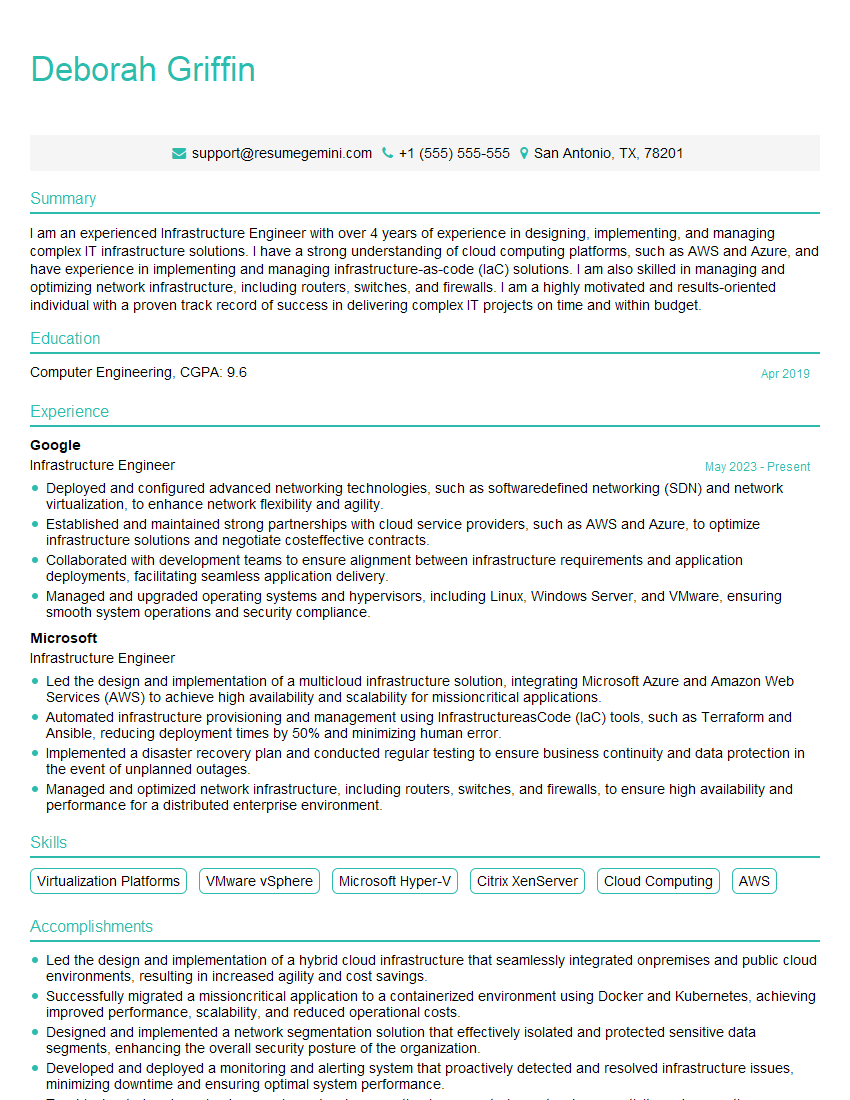
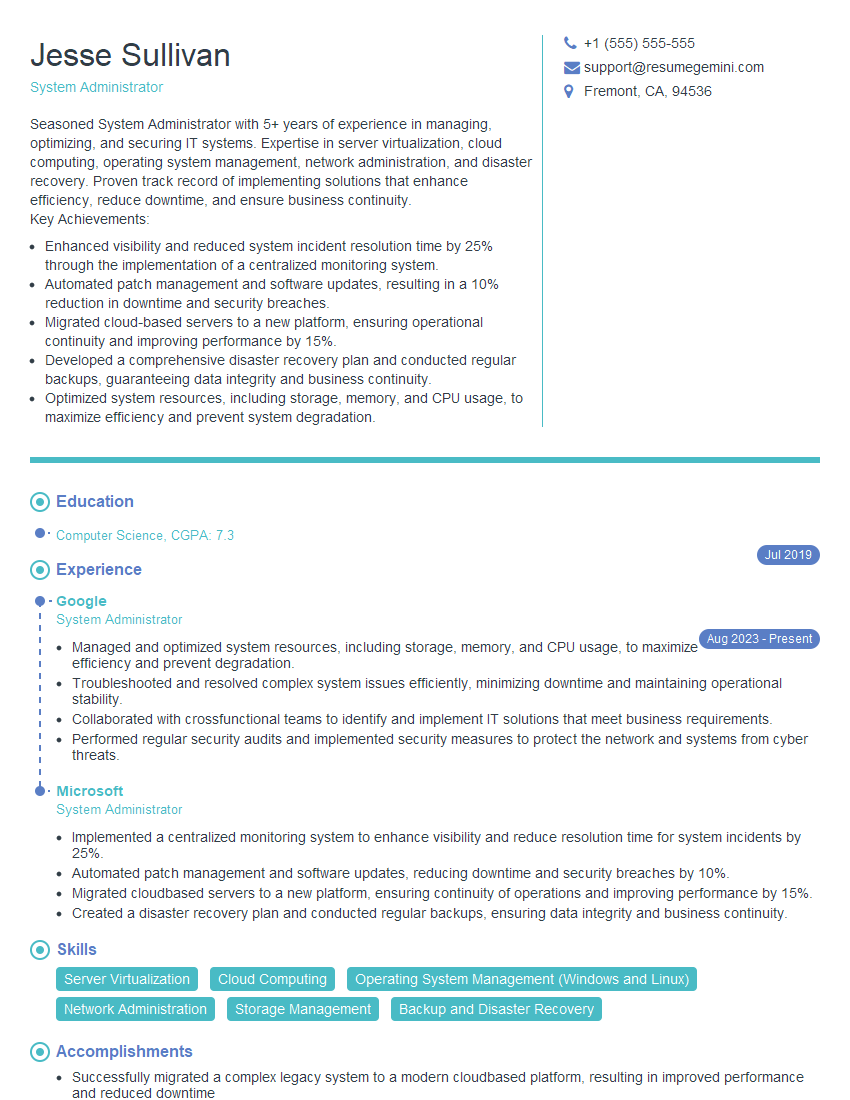
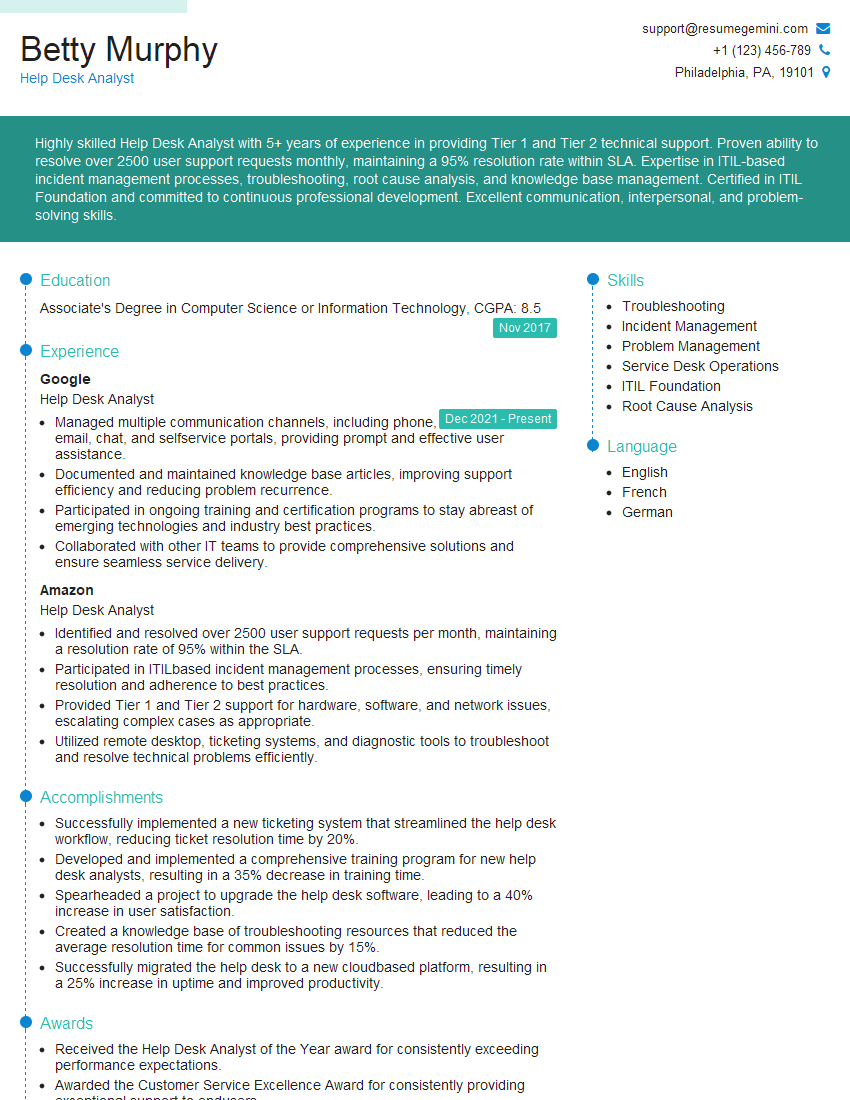
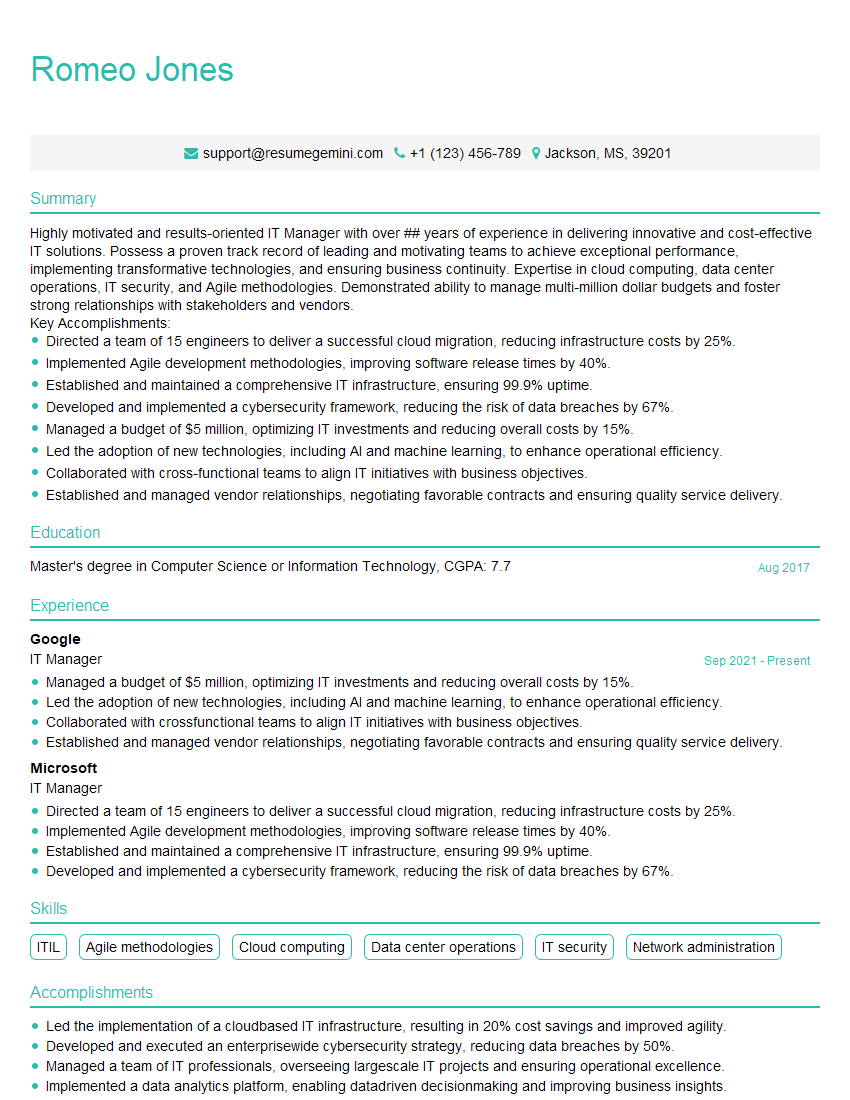
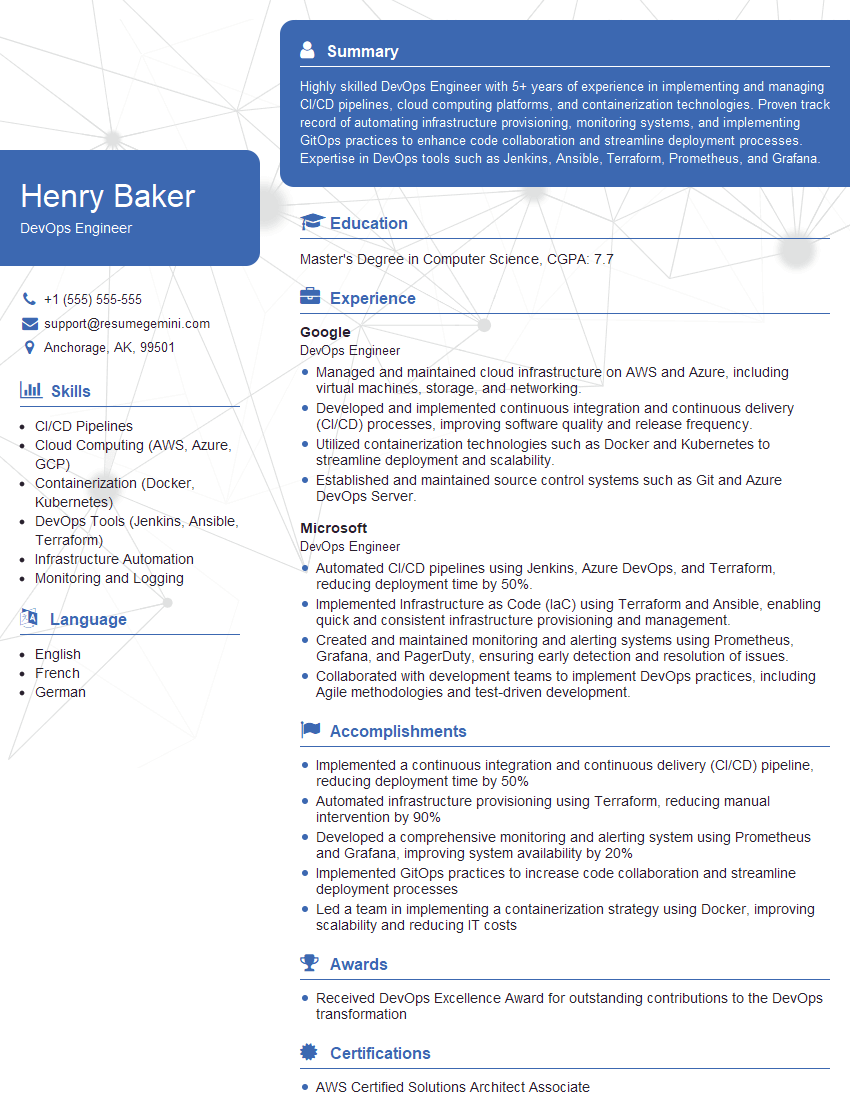
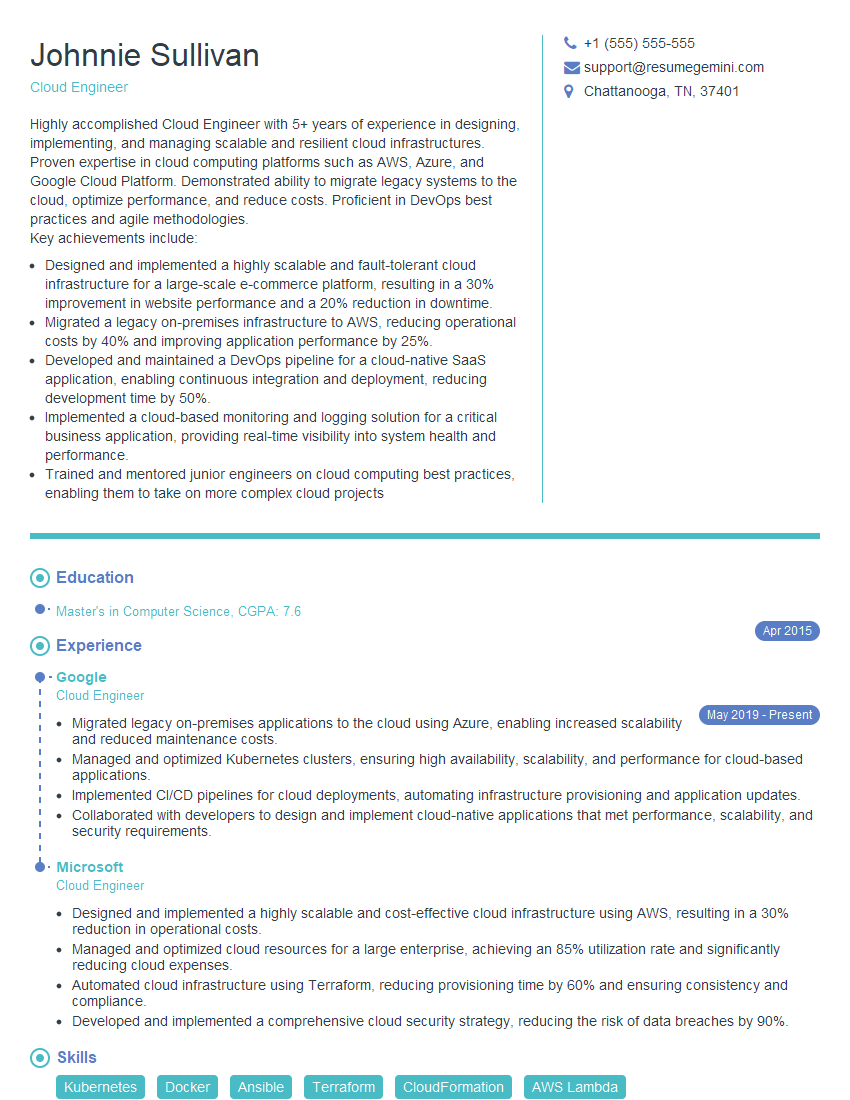
Mastering the ability to troubleshoot and resolve production issues is paramount for career advancement in any technical field. It demonstrates critical thinking, problem-solving skills, and a proactive approach to maintaining system stability. To significantly boost your job prospects, create an ATS-friendly resume that clearly highlights these crucial skills. ResumeGemini is a trusted resource to help you build a professional and impactful resume tailored to your experience. Examples of resumes tailored to highlight expertise in troubleshooting and resolving production issues are available through ResumeGemini, showcasing how to effectively present your capabilities to potential employers.
Explore more articles
Users Rating of Our Blogs
Share Your Experience
We value your feedback! Please rate our content and share your thoughts (optional).
What Readers Say About Our Blog
I Redesigned Spongebob Squarepants and his main characters of my artwork.
https://www.deviantart.com/reimaginesponge/art/Redesigned-Spongebob-characters-1223583608
IT gave me an insight and words to use and be able to think of examples
Hi, I’m Jay, we have a few potential clients that are interested in your services, thought you might be a good fit. I’d love to talk about the details, when do you have time to talk?
Best,
Jay
Founder | CEO
