The thought of an interview can be nerve-wracking, but the right preparation can make all the difference. Explore this comprehensive guide to Problem Diagnosis interview questions and gain the confidence you need to showcase your abilities and secure the role.
Questions Asked in Problem Diagnosis Interview
Q 1. Describe your process for diagnosing a complex technical problem.
Diagnosing complex technical problems requires a methodical approach. I employ a structured process that combines deductive reasoning with iterative testing. It typically begins with a thorough understanding of the problem’s symptoms. This involves gathering information from various sources, including error logs, user reports, and system monitoring tools. Next, I formulate hypotheses about the potential root causes, focusing on the most likely scenarios based on my experience and knowledge of the system. I then design and execute tests to validate or invalidate each hypothesis, systematically eliminating possibilities until the root cause is identified. This process often involves isolating components of the system to pinpoint the source of the malfunction. Finally, I document my findings, including the problem’s root cause, the steps taken to diagnose it, and the implemented solution. This documentation is crucial for future troubleshooting and knowledge sharing.
For instance, if a web application is experiencing slow response times, I might start by checking server resource utilization (CPU, memory, network I/O), database query performance, and the application code itself. Each checked element will be tested and documented. If the server is overloaded, I investigate resource allocation. If database queries are slow, I’ll analyze query performance. If code is the issue, I’ll employ debugging techniques such as stepping through code or using logs.
Q 2. How do you prioritize multiple issues when troubleshooting?
Prioritizing multiple issues during troubleshooting hinges on assessing their impact and urgency. I employ a risk-based prioritization method. I categorize issues based on severity (critical, major, minor) and their impact on business operations or user experience. Critical issues that severely disrupt services or cause data loss get immediate attention. Major issues that significantly impair functionality or user experience are next. Minor issues that have minimal impact are addressed after the more critical ones are resolved. This prioritization ensures that the most impactful problems are addressed first, minimizing downtime and maintaining system stability. I use a system such as a ticketing system, to track and manage these issues. This system facilitates tracking progress and ensures accountability.
For example, if a system has both a critical database error preventing all user logins and a minor UI bug affecting the visual presentation of a report, the database error takes precedence because user access is paramount.
Q 3. Explain a time you used a systematic approach to identify the root cause of a problem.
In a previous role, our e-commerce platform experienced a sudden surge in order cancellations. Initially, the problem seemed scattered, with various error messages reported by users. I systematically investigated the issue by first consolidating all error reports and logs. I noticed a pattern: most cancellations occurred after users attempted to use a specific payment gateway. I then isolated this payment gateway by temporarily disabling it, which immediately stopped the cancellations. Further investigation of the gateway’s logs revealed an error related to its communication with the payment processor. The root cause turned out to be a recent API change on the payment processor’s end that wasn’t properly handled by our gateway integration. By systematically eliminating potential issues and focusing on consistent error patterns, I pinpointed the root cause – a misconfiguration in the payment gateway’s API handling.
Q 4. How do you handle situations where the root cause of a problem is unclear?
When the root cause is unclear, a more exploratory approach is needed. I leverage several techniques. First, I expand my data collection. This includes examining more logs, system metrics, and user interactions. I also involve other team members with diverse expertise, generating multiple perspectives. If necessary, I employ advanced debugging tools such as network analyzers or memory profilers to pinpoint subtle issues. Furthermore, I conduct controlled experiments to isolate variables and narrow down possibilities. This might involve temporarily disabling features or components to observe their effect on the problem. Finally, if all else fails, escalating the issue to a senior engineer or external expert may be necessary to provide more in depth analysis and expertise.
Think of it like detective work; you might start with broad clues and gradually narrow down your focus as you gather more evidence.
Q 5. What tools and techniques do you use for problem diagnosis?
My problem diagnosis toolkit is extensive and depends on the specific context. Common tools include:
- Monitoring tools: These tools such as Nagios, Zabbix, or Datadog, provide real-time visibility into system performance and resource usage.
- Logging tools: Tools like Elasticsearch, Fluentd, and Kibana (the ELK stack) help aggregate and analyze log data to identify patterns and errors.
- Debugging tools: Debuggers such as gdb or pdb (Python debugger) enable stepping through code to identify errors.
- Network analyzers: Wireshark and tcpdump allow inspection of network traffic to pinpoint communication issues.
- Profilers: These tools measure code performance to identify bottlenecks.
- Version control systems: Git and others allow for reviewing code changes to find the source of introduced errors.
Beyond tools, my techniques include systematic testing, code reviews, root cause analysis methodologies (like the 5 Whys), and effective communication with stakeholders.
Q 6. How do you determine the severity of a problem?
Determining problem severity involves evaluating its impact on users and the business. I use a combination of factors:
- Impact on users: How many users are affected? Is their workflow severely disrupted? Is data lost or corrupted?
- Impact on business: Does the problem affect revenue, compliance, or reputation? How much downtime is caused?
- Urgency: How quickly does the problem need to be resolved? Are there service level agreements (SLAs) to consider?
By considering these aspects, I can categorize problems as critical (immediate attention required, major business impact), major (significant impact, requires quick resolution), minor (minimal impact, can be addressed later), or informational (alerts/warnings that may indicate potential future problems).
Q 7. How do you communicate technical issues to non-technical audiences?
Communicating technical issues to non-technical audiences requires clear and concise language, avoiding jargon. I focus on explaining the problem’s impact in terms they understand, using analogies and simple language. For instance, instead of saying “the database experienced a deadlock,” I might explain, “Imagine a traffic jam on a highway – the database processes got stuck, blocking each other, so things slowed down and eventually stopped working.” I also prioritize visualizing data using charts and graphs to make complex information easier to digest. I always summarize the problem’s impact, the actions being taken to resolve it, and the estimated time to resolution.
It’s about translating technical details into relatable scenarios, focusing on the “what” and “why” rather than getting bogged down in technical “how”.
Q 8. Describe your experience with remote diagnostics.
Remote diagnostics is a crucial skill in today’s interconnected world. It involves troubleshooting technical issues from a distance, relying on tools and communication to identify and resolve problems. My experience spans several years, working across various platforms and technologies. I’ve successfully diagnosed and fixed problems ranging from simple network connectivity issues to complex application errors in geographically dispersed systems.
For instance, I once remotely diagnosed a server failure for a client across the country. Using remote desktop software, I analyzed system logs, checked resource utilization, and ultimately discovered a failing hard drive. By guiding the client through a remote drive replacement, we minimized downtime and avoided costly on-site visits. Another example involved diagnosing intermittent network outages for a large enterprise client. By analyzing network traffic logs remotely and coordinating with their internal IT team, we pinpointed a faulty router within their network infrastructure.
My approach always begins with a thorough understanding of the client’s environment and the problem description. I then systematically use remote tools such as remote desktop access, command-line interfaces, and network monitoring utilities to investigate the issue. Effective communication is paramount; I make sure to keep the client informed throughout the process, explaining the steps taken and the progress being made.
Q 9. How do you stay updated on the latest troubleshooting techniques?
Staying updated in the fast-paced field of troubleshooting requires a multi-faceted approach. I actively participate in online communities and forums dedicated to problem diagnosis and specific technologies I work with. These platforms offer valuable insights from other experts, discussions of emerging issues, and shared solutions. Furthermore, I regularly read industry publications, blogs, and white papers from reputable sources.
I also make it a point to attend webinars, conferences, and workshops focused on troubleshooting methodologies and emerging technologies. These events offer a chance to network with peers and learn about the latest tools and techniques. Crucially, I actively seek out and participate in training programs offered by vendors or professional organizations to deepen my knowledge and proficiency in the latest software and hardware. Finally, hands-on practice is indispensable. I regularly work on personal projects and engage in experimental troubleshooting to reinforce my skills and stay ahead of the curve.
Q 10. How do you document your problem-solving process?
Thorough documentation is essential for efficient problem-solving and future reference. My documentation strategy follows a structured approach. I begin by meticulously recording the initial problem description, including error messages, timestamps, and any relevant environmental details. Then, every step taken in the troubleshooting process is documented, including the tools used, commands executed, and the results observed. This includes both successful and unsuccessful attempts – learning from mistakes is paramount.
I usually use a ticketing system with detailed fields for each step. This allows easy tracking of the entire resolution process. I also include screenshots or screen recordings when necessary to visually illustrate certain aspects of the issue or the troubleshooting steps. Finally, I conclude with a summary of the root cause, the implemented solution, and any preventive measures taken to avoid similar issues in the future. This detailed documentation helps not just me but also other team members in understanding the resolution and avoids repetition of work.
Q 11. Have you ever had to escalate a problem to a higher level? Describe the process.
Escalating a problem is a critical part of efficient problem resolution, especially when the issue is beyond my expertise or requires access to specialized resources. My process starts with a thorough assessment of the problem and what I’ve already tried. If I’ve exhausted all possible solutions within my scope of knowledge and the issue remains critical, I gather all relevant information, including documentation of my troubleshooting steps, error logs, and system configurations.
I then clearly articulate the problem and the steps I’ve already taken to my supervisor or the appropriate escalation team. This includes concisely explaining the impact of the problem, the urgency of resolution, and what resources are needed to resolve it. I maintain clear and open communication throughout the escalation process, updating the team and providing regular status updates. Once the problem is resolved, I document the resolution steps taken by the higher-level team, learning from their expertise to improve my future problem-solving skills.
For example, I once encountered a complex network routing issue that required expertise in a specific proprietary network technology I wasn’t fully proficient in. After documenting my efforts and communicating the issue clearly, the escalation team, with specialized knowledge, quickly resolved the problem by identifying a misconfiguration in the routing table.
Q 12. How do you handle pressure when troubleshooting critical systems?
Troubleshooting critical systems under pressure requires a calm, methodical approach. My strategy centers on maintaining a clear head and focusing on the most critical aspects of the problem first. This starts with prioritizing the steps necessary to minimize damage and prevent further issues. I then systematically work through my troubleshooting plan, focusing on one issue at a time. My experience has taught me that panic often exacerbates the situation, whereas a structured approach allows for focused problem-solving.
I utilize effective time management techniques like breaking down the problem into smaller, manageable tasks, setting realistic goals for each step and prioritizing them by impact. Open communication with stakeholders is key to managing expectations during critical situations. This involves keeping them informed about progress, challenges, and potential solutions. Seeking help from colleagues when needed is not a sign of weakness but a sign of efficient teamwork. It ensures that expertise is brought to bear when needed and prevents unnecessary delays.
Q 13. What is your approach to identifying recurring problems?
Identifying recurring problems involves a combination of careful analysis, detailed record-keeping, and proactive monitoring. I begin by reviewing past incident reports and logs to identify patterns in similar issues. This could involve looking for common error messages, timestamps, or specific system components that are frequently involved in the problems. I then analyze the root cause of these incidents to identify underlying issues. This could involve reviewing system logs, network monitoring data, or application performance metrics.
Once potential root causes are identified, I implement preventive measures. This could involve configuring automated alerts for early detection of similar issues, enhancing system monitoring to detect potential problems before they escalate, and making improvements to system design or configurations to prevent future occurrences. Regularly reviewing system performance metrics, and comparing them against historical data, helps in identifying trends and anomalies that might indicate recurring problems before they impact users. This proactive approach keeps the systems running smoothly and allows for preventive measures to be implemented, averting major disruptions.
Q 14. Describe a time you had to make a critical decision during problem diagnosis.
During a major system upgrade, we encountered an unexpected database corruption issue that threatened to derail the entire project. The decision to rollback the upgrade immediately versus attempting a more complex in-place repair was critical. The system was already partially upgraded, and a failed in-place repair could have resulted in catastrophic data loss and significantly longer downtime.
After careful evaluation of the risks and benefits, and after consulting with senior engineers, I made the decision to rollback to the previous stable version. This decision, though seemingly drastic, minimized data loss and ensured a quicker recovery. Although it meant delaying the upgrade, it prioritized data integrity and system stability, preventing a far more serious incident. After the rollback, we thoroughly investigated the cause of the database corruption and implemented preventive measures to avoid similar issues in future upgrades.
Q 15. How do you use logs and error messages to diagnose issues?
Logs and error messages are the bread and butter of problem diagnosis. They provide a chronological record of system events, including actions, errors, and warnings. Think of them as a detective’s case file – they tell a story of what happened leading up to the issue.
My approach involves several steps:
- Identifying the relevant logs: Different systems (operating systems, applications, databases) generate various logs. Knowing where to look is crucial. For example, system errors on a Linux machine might be in
/var/log/syslog, while application errors might be in dedicated log files within the application’s directory. - Filtering and searching: Logs can be voluminous. I use tools like
grep(on Linux/macOS), or specialized log management systems to filter by keywords related to the observed problem (e.g., error codes, timestamps around the issue’s occurrence). - Analyzing error messages: Error messages often contain invaluable information, including the specific error code, the location (file and line number) of the error, and the context in which it occurred. Understanding the error message requires not just technical knowledge but also careful reading and interpretation.
- Correlation: I look for patterns and correlations between different entries in the log. A seemingly unrelated log entry from minutes before the actual error might hold the key to the root cause.
Example: Imagine a web application suddenly becoming slow. Analyzing the web server logs might reveal a spike in database queries, suggesting a problem with the database performance rather than the web server itself. Further examination of database logs could then pinpoint the problematic query.
Career Expert Tips:
- Ace those interviews! Prepare effectively by reviewing the Top 50 Most Common Interview Questions on ResumeGemini.
- Navigate your job search with confidence! Explore a wide range of Career Tips on ResumeGemini. Learn about common challenges and recommendations to overcome them.
- Craft the perfect resume! Master the Art of Resume Writing with ResumeGemini’s guide. Showcase your unique qualifications and achievements effectively.
- Don’t miss out on holiday savings! Build your dream resume with ResumeGemini’s ATS optimized templates.
Q 16. How familiar are you with different diagnostic tools (e.g., debuggers, network analyzers)?
I’m proficient with a range of diagnostic tools, categorized by their focus:
- Debuggers (e.g., GDB, LLDB, Visual Studio Debugger): These tools allow step-by-step code execution, inspection of variables, and identification of the exact point where a software error occurs. I use debuggers extensively when tracking down complex software bugs.
- Network Analyzers (e.g., Wireshark, tcpdump): These tools capture and analyze network traffic, enabling me to troubleshoot network connectivity issues, identify bottlenecks, and inspect network packets for errors or anomalies. For example, I might use Wireshark to investigate why a network application is failing to connect to a server.
- System Monitoring Tools (e.g., top, htop, Performance Monitor): These provide real-time insights into system resource usage (CPU, memory, disk I/O). Identifying high CPU or memory utilization often points to performance bottlenecks or resource leaks.
- Log Management Systems (e.g., Splunk, ELK stack): These centralize and analyze log data from multiple sources, allowing for efficient searching, pattern recognition, and correlation of events across different systems.
My tool selection is driven by the nature of the problem. For a network connectivity issue, I’d reach for a network analyzer. For a complex software crash, a debugger is my go-to tool. The effective use of these tools demands a deep understanding of both the underlying systems and the problem domain.
Q 17. Describe your experience with different operating systems and their troubleshooting methods.
I have extensive experience troubleshooting on various operating systems, including Windows, macOS, Linux (various distributions), and several embedded systems. Each OS has its own quirks, strengths, and troubleshooting approaches. However, the fundamental principles remain the same – gathering information, forming a hypothesis, testing the hypothesis, and iterating until the root cause is found.
Windows: I’m familiar with using the Event Viewer, Resource Monitor, and various command-line tools. I often leverage PowerShell scripting for automating tasks during troubleshooting.
macOS: Similar to Windows, macOS has its system logs and monitoring tools. The command line provides powerful diagnostic capabilities.
Linux: I’m adept at using command-line tools like top, htop, ps, lsof, netstat, and dmesg to analyze processes, network connections, and kernel messages.
Troubleshooting across different operating systems involves adapting my approach to the unique tools and log formats of each system, but the core problem-solving methodology remains consistent.
Q 18. What are some common pitfalls to avoid during problem diagnosis?
Several common pitfalls can significantly hinder problem diagnosis. Avoid these:
- Jumping to conclusions: Resist the urge to assume the cause before gathering sufficient evidence. A systematic approach, driven by data, is crucial.
- Ignoring basic checks: Simple steps, such as restarting a service or checking network connectivity, are often overlooked but can resolve many issues quickly.
- Insufficient logging: Inadequate logging makes diagnosis difficult. Ensure sufficient logging is enabled in all critical system components.
- Overlooking environmental factors: Changes in the network infrastructure, recent software updates, or even physical conditions (temperature, power) can cause problems. Consider the broader context.
- Not documenting findings: Thorough documentation is essential for future reference, especially when dealing with recurring problems.
- Tunnel vision: Focusing on one aspect of the problem may lead you to miss alternative causes. Keep an open mind and consider multiple possibilities.
Example: Assuming a slow web application is due to server overload without checking the database connection, network latency, or client-side performance is a classic example of jumping to conclusions.
Q 19. How do you determine whether a problem is hardware or software related?
Determining whether a problem is hardware or software-related often involves a process of elimination.
Steps to take:
- Gather Information: Start by collecting information about the problem – what are the symptoms, when did it start, what actions preceded it?
- Isolate the Problem: Try to replicate the issue. Can you reproduce it consistently? Does it happen only under certain conditions? Isolate the affected component – is it the whole system, a particular application, or a specific hardware device?
- Check for Error Messages: Software problems usually leave error messages in logs or on the screen. Hardware problems may manifest as unusual behavior (e.g., beeping sounds, system instability), but often require more specialized diagnostic tools.
- Run Diagnostics: Use built-in diagnostics tools (e.g., CHKDSK for disk errors, memory diagnostic tools) or specialized hardware testing software.
- Hardware Testing: If you suspect hardware issues, consider swapping components (e.g., RAM sticks, hard drives) to see if the problem moves with the hardware. Note that this requires some experience with hardware handling and may void warranties if not done correctly.
- Software Testing: Try reverting to previous software versions, reinstalling software, updating drivers, or performing system restores to see if the problem disappears.
Example: If a computer won’t boot, and you hear repeated beeping sounds, it’s a strong indication of a hardware issue (likely RAM, motherboard, or power supply). If applications crash frequently but the system itself is stable, the problem likely lies in software.
Q 20. How do you utilize metrics and data to inform your diagnosis?
Metrics and data are essential for informing diagnosis. They provide objective evidence to support hypotheses and validate solutions.
How I utilize metrics and data:
- System Performance Metrics: I monitor CPU usage, memory utilization, disk I/O, network traffic, and other system performance indicators. Deviations from the norm often point to performance bottlenecks or resource exhaustion.
- Application Logs and Metrics: Application-specific metrics (e.g., transaction times, error rates, request counts) provide insight into application behavior and identify potential problems.
- Network Metrics: Analyzing network traffic patterns, latency, and packet loss helps identify network-related problems.
- Data Visualization: I use tools to visualize metrics and identify trends and anomalies. Graphs and charts make it easier to spot patterns that might be missed when examining raw data.
Example: Observing a sharp increase in database query times accompanied by high disk I/O suggests that a database performance issue may be the root cause of slow application performance.
Q 21. How do you balance speed and accuracy in problem diagnosis?
Balancing speed and accuracy in problem diagnosis is a constant challenge. The ideal scenario is to quickly find the root cause without overlooking critical details.
My approach involves:
- Prioritization: Focus on the most critical aspects of the problem first. Determine the impact and urgency of the issue before diving deep into details. If the system is completely down, the focus is on getting it back online; if it’s a minor performance issue, a more thorough investigation can be performed later.
- Structured Approach: Following a systematic process helps ensure that no critical steps are missed. It reduces the likelihood of overlooking crucial clues and saves time in the long run.
- Hypothesis-driven Approach: Forming hypotheses based on initial observations and quickly testing them helps refine the search space. This iterative approach allows you to quickly eliminate unlikely causes.
- Automation: Use scripting and automation wherever possible to speed up repetitive tasks (e.g., checking log files, running diagnostics).
- Collaboration: If the problem is complex, don’t hesitate to seek help from colleagues or experts. A fresh perspective can often bring new insights.
Example: In a production environment where a critical system has failed, the first priority is restoring service, even if this involves a temporary workaround rather than a complete root cause analysis. A more in-depth analysis can be conducted during a less critical time.
Q 22. Describe your experience with incident management processes.
Incident management is the process of identifying, analyzing, resolving, and documenting incidents to minimize disruption to services. My experience spans several years, encompassing various methodologies like ITIL. I’ve been involved in all phases, from initial incident logging and categorization through to resolution and post-incident review. This includes collaborating with cross-functional teams – developers, network engineers, security specialists – to rapidly restore service and prevent recurrence.
For example, in a previous role, I spearheaded the implementation of a new incident management system, resulting in a 20% reduction in incident resolution time. This involved not only selecting the right software but also training the team on best practices, developing clear escalation paths, and establishing robust communication protocols.
- Incident Logging and Categorization: Accurately recording incident details, assigning severity levels, and routing them to appropriate teams.
- Diagnosis and Resolution: Employing troubleshooting techniques and leveraging monitoring tools to pinpoint the root cause and implement effective fixes.
- Communication and Escalation: Keeping stakeholders informed throughout the process, escalating critical incidents to senior management as needed.
- Post-Incident Review: Analyzing the incident to identify root causes, suggest improvements to processes, and prevent future occurrences.
Q 23. How do you ensure the reproducibility of a diagnosed issue?
Reproducibility is crucial for effective problem-solving. To ensure it, I meticulously document every step of the diagnostic process. This includes detailed descriptions of the environment (hardware, software versions, configurations), the steps taken to reproduce the issue, and the observed results. I rely heavily on version control systems for software and detailed logs for both the system and applications involved.
Imagine diagnosing a network connectivity issue. Simply stating ‘the network is down’ is insufficient. I would record the specific devices affected, the network topology, timestamps of when the issue began and ended, network diagnostic test results (ping, traceroute), and any error messages encountered. This meticulous documentation allows others to reproduce the issue and verify the solution, crucial for collaborative problem-solving and future prevention.
Moreover, I utilize automated testing where possible to validate the fix and ensure it doesn’t introduce new problems. This often involves creating automated scripts or using existing test frameworks to repeatedly check the functionality that was impacted by the issue.
Q 24. How do you prioritize your tasks during a critical incident?
Prioritization during a critical incident demands a structured approach. I use a combination of factors including severity, impact, and urgency. Severity refers to the technical nature of the problem, while impact describes its consequences on business operations, and urgency is tied to the time constraint for resolution.
I often employ a matrix to visualize the prioritization, using a framework like this:
- High Severity, High Impact, High Urgency (Critical): Immediate action required. All hands-on-deck approach.
- High Severity, High Impact, Low Urgency (Major): Requires swift action, though perhaps not immediate.
- Low Severity, Low Impact, Low Urgency (Minor): Can be scheduled for resolution.
For example, a complete system outage (High Severity, High Impact, High Urgency) would take precedence over a minor performance degradation (Low Severity, Low Impact, Low Urgency). Clear communication is vital during prioritization, keeping all stakeholders informed of the strategy and timeline.
Q 25. How do you measure the effectiveness of your problem-solving methods?
Measuring the effectiveness of problem-solving involves both qualitative and quantitative metrics. Quantitative metrics include:
- Mean Time To Resolution (MTTR): The average time it takes to resolve an incident.
- Mean Time Between Failures (MTBF): The average time between incidents of the same type.
- Incident Resolution Rate: The percentage of incidents resolved successfully.
- Customer Satisfaction (CSAT): Feedback from users affected by the incident.
Qualitative metrics involve assessing the completeness of the root cause analysis, the effectiveness of implemented solutions in preventing recurrence, and the overall improvement in system stability and resilience. Regular post-incident reviews are essential for collecting this data and making data-driven improvements to our approach.
For instance, a reduction in MTTR and an increase in CSAT scores directly reflect the improvement in our problem-solving effectiveness.
Q 26. What is your experience with root cause analysis techniques?
I’m proficient in several root cause analysis (RCA) techniques, including the ‘5 Whys,’ Fishbone diagrams (Ishikawa diagrams), and Fault Tree Analysis (FTA). The choice of technique depends on the complexity of the issue and the available data. The ‘5 Whys’ is a simple yet effective method for iterative questioning to uncover the underlying cause.
For example, if a web application is slow, the 5 Whys might go like this:
- Why is the web application slow? Because the database is unresponsive.
- Why is the database unresponsive? Because the database server is overloaded.
- Why is the database server overloaded? Because of an unusually high number of concurrent users.
- Why is there an unusually high number of concurrent users? Because of a recent marketing campaign.
- Why did the marketing campaign not account for the increased load? Because of inadequate capacity planning.
Fishbone diagrams help to visually organize potential causes categorized by different contributing factors (people, processes, materials, etc.). FTA is more suited for complex systems and helps in identifying potential failure points and their probabilities.
Q 27. Describe a situation where your problem-solving skills saved the day.
In a previous role, our e-commerce platform experienced a critical outage during a major sales event. The website became completely inaccessible, resulting in significant financial losses and customer dissatisfaction. Initial diagnostics pointed to a database issue, but the root cause remained elusive.
Using a combination of log analysis, network monitoring, and database performance metrics, I discovered that a poorly configured load balancer was misdirecting traffic, overwhelming a single database server. This led to a cascading failure, bringing down the entire system. By swiftly identifying this unexpected configuration issue, reconfiguring the load balancer, and restoring traffic distribution, we were able to restore service within an hour. This averted substantial financial losses and prevented significant damage to our reputation. This experience reinforced the importance of thorough investigation and not relying solely on initial assumptions.
Q 28. Explain your experience with different types of diagnostic software.
My experience encompasses a wide range of diagnostic software, including network monitoring tools (e.g., SolarWinds, PRTG), system monitoring tools (e.g., Zabbix, Nagios), log management systems (e.g., Splunk, ELK stack), and application performance monitoring (APM) tools (e.g., Dynatrace, New Relic). I’m also comfortable using debugging tools specific to different programming languages, like debuggers integrated into IDEs.
For instance, I’ve used Splunk to analyze vast quantities of log data to pinpoint the source of intermittent errors in a distributed system. In another situation, I leveraged an APM tool to identify performance bottlenecks within a Java application and optimize code for improved response times. Familiarity with these tools is vital for effective diagnosis in complex IT environments. Understanding the strengths and limitations of each tool is crucial for selecting the most appropriate one for a given situation.
Key Topics to Learn for Problem Diagnosis Interview
- Systematic Troubleshooting Methodologies: Understand and articulate different approaches like the five whys, fault tree analysis, and root cause analysis. Practice applying these methods to hypothetical scenarios.
- Data Analysis for Diagnosis: Learn how to effectively interpret logs, metrics, and other data sources to pinpoint the source of a problem. Consider practicing with sample datasets or logs.
- Communication and Collaboration: Mastering clear and concise communication is crucial. Practice explaining complex technical issues to both technical and non-technical audiences. Emphasize active listening and collaborative problem-solving.
- Prioritization and Time Management: Demonstrate your ability to prioritize critical issues and efficiently manage your time during a crisis or under pressure. Prepare examples showcasing your ability to handle multiple tasks effectively.
- Understanding System Architecture: A strong understanding of the system you’re troubleshooting is essential. Focus on how different components interact and how failures in one area can impact others. Prepare to discuss various system architectures and their implications for diagnosis.
- Technical Proficiency: Depending on the role, this will vary. Ensure you’re confident in your skills related to relevant technologies and tools used in problem diagnosis within your field.
- Problem Prevention and Mitigation: Showcase your ability to anticipate potential problems and proactively implement solutions to prevent future issues. Consider preparing examples of proactive measures you’ve taken.
Next Steps
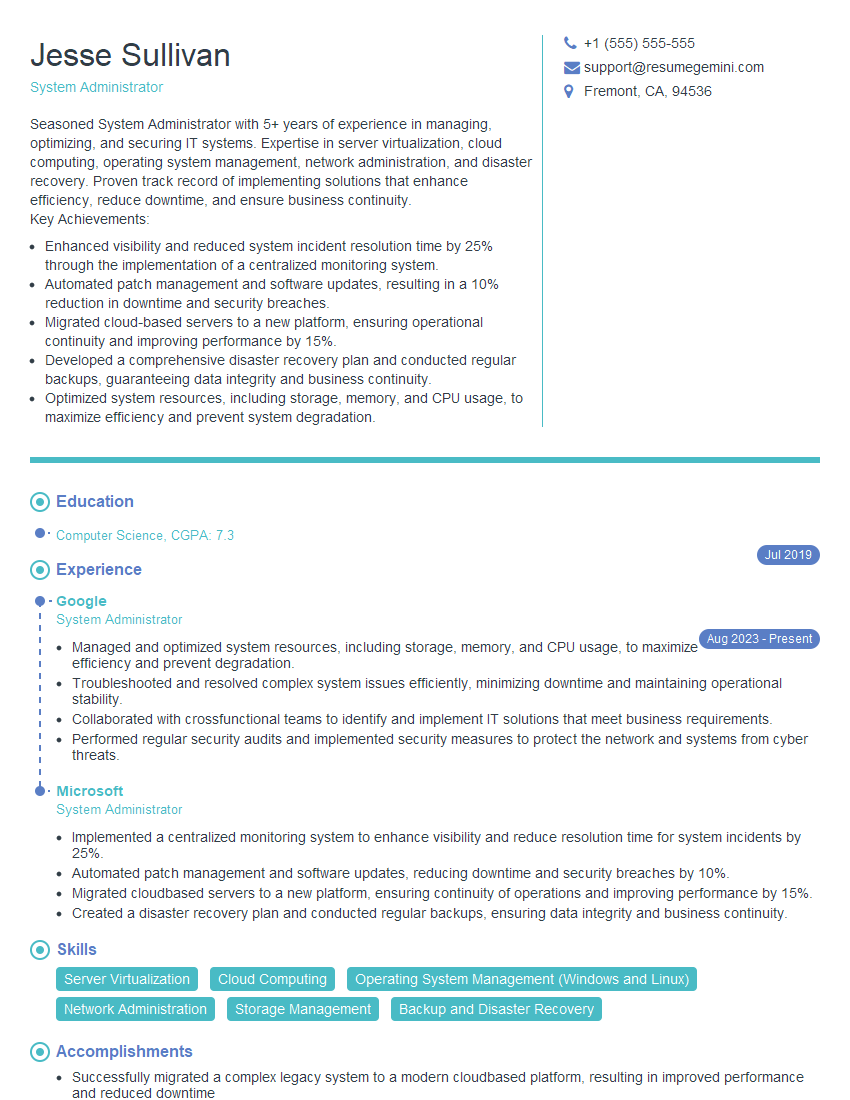
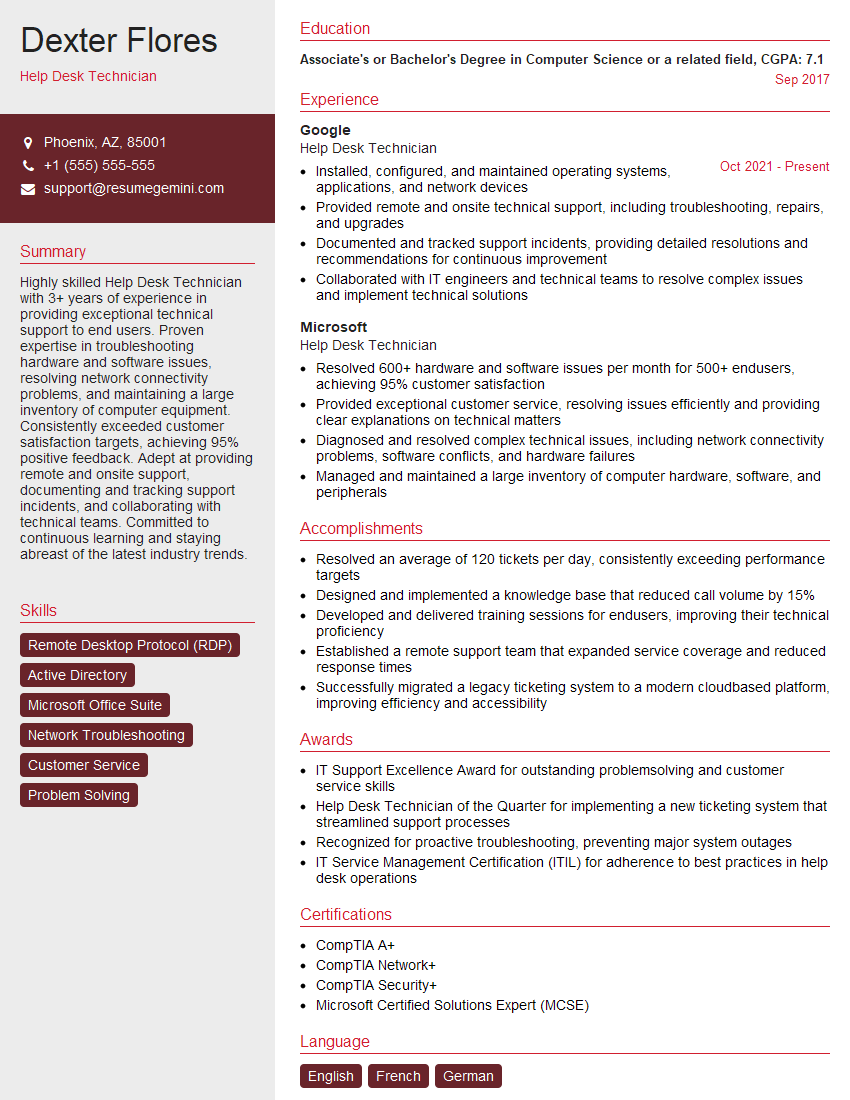
Mastering problem diagnosis is invaluable for career advancement, opening doors to leadership roles and specialized positions requiring advanced troubleshooting expertise. To maximize your job prospects, invest time in crafting an ATS-friendly resume that highlights your problem-solving skills and experience. ResumeGemini can significantly enhance your resume-building experience, helping you create a professional and impactful document that catches the eye of recruiters. Examples of resumes tailored to Problem Diagnosis are available to help you get started.
Explore more articles
Users Rating of Our Blogs
Share Your Experience
We value your feedback! Please rate our content and share your thoughts (optional).
What Readers Say About Our Blog
Hi, I’m Jay, we have a few potential clients that are interested in your services, thought you might be a good fit. I’d love to talk about the details, when do you have time to talk?
Best,
Jay
Founder | CEO
