Cracking a skill-specific interview, like one for Analytical Thinking and Problem-Solving Abilities, requires understanding the nuances of the role. In this blog, we present the questions you’re most likely to encounter, along with insights into how to answer them effectively. Let’s ensure you’re ready to make a strong impression.
Questions Asked in Analytical Thinking and Problem-Solving Abilities Interview
Q 1. Describe your approach to solving a complex problem.
My approach to solving complex problems is systematic and iterative. I begin by clearly defining the problem, ensuring I understand its scope and impact. This involves gathering information from various sources and stakeholders to paint a complete picture. Next, I break down the problem into smaller, more manageable sub-problems. This decomposition makes the problem less daunting and allows for focused effort. I then prioritize these sub-problems based on their impact and feasibility. For each sub-problem, I explore potential solutions, evaluating their pros and cons using a structured approach like a decision matrix or cost-benefit analysis. After selecting a solution, I implement it, monitor its effectiveness, and iterate based on the results. This iterative process allows for course correction and continuous improvement. I believe in rigorous documentation throughout this process to facilitate collaboration and future reference. Think of it like building with LEGOs – you start with a large, complex structure and break it down into smaller, manageable pieces, assembling them step-by-step to achieve the final result.
Q 2. How do you identify the root cause of a problem?
Identifying the root cause of a problem often involves employing the ‘5 Whys’ technique or a more formal root cause analysis (RCA) methodology like the Fishbone diagram. The 5 Whys involves repeatedly asking ‘Why?’ to drill down to the underlying issue. For example, if a project is delayed, I might ask: Why is the project delayed? (Insufficient resources). Why are there insufficient resources? (Budget cuts). Why were there budget cuts? (Unexpected expenses). Why were there unexpected expenses? (Poor risk management). Why was the risk management poor? (Lack of training). The final ‘why’ often reveals the root cause. A Fishbone diagram visually maps out potential causes, helping to systematically explore various contributing factors. I often combine these techniques with data analysis to identify patterns and correlations that might point to the root cause. It’s crucial to avoid jumping to conclusions and instead rigorously investigate all plausible explanations.
Q 3. Explain a time you had to analyze a large dataset to identify trends.
In a previous role, I analyzed a large dataset containing customer transaction data to identify purchasing trends. The dataset contained millions of records and spanned several years. I used SQL to extract relevant data, focusing on variables such as purchase frequency, product categories, and customer demographics. Then, I leveraged tools like Tableau and Python libraries (Pandas, Matplotlib, Seaborn) to visualize the data. This involved creating various charts and graphs, including histograms, scatter plots, and time series plots. Through analysis, I identified seasonal purchasing patterns, specific product combinations frequently purchased together, and demographic segments with differing purchasing habits. For example, I found a significant increase in online purchases during holiday seasons and a strong correlation between age group and preferred product categories. These insights were crucial for informing marketing strategies and inventory management.
Q 4. How do you prioritize tasks when faced with multiple competing deadlines?
When faced with multiple competing deadlines, I use a prioritization matrix that considers both urgency and importance. I assign each task a level of urgency (high, medium, low) and importance (high, medium, low). Tasks with high urgency and high importance are tackled first. Then, I move onto high-importance, medium-urgency tasks, and so on. This approach ensures that critical tasks are addressed promptly while less crucial tasks are still managed effectively. I also utilize time management techniques like time blocking and the Pomodoro Technique to optimize my workflow and ensure focused work periods. Communication is key – I proactively inform stakeholders of potential delays or adjustments to deadlines, ensuring transparency and collaboration. Sometimes, it’s necessary to re-negotiate deadlines if the workload is truly unsustainable, a discussion that needs to be had respectfully and proactively.
Q 5. Describe your experience using data analysis tools.
I have extensive experience using a variety of data analysis tools. My proficiency includes SQL for data extraction and manipulation, Python with libraries like Pandas, NumPy, and Scikit-learn for data cleaning, analysis, and machine learning, and visualization tools such as Tableau and Power BI for creating interactive dashboards and reports. I’m also familiar with statistical software like R and specialized tools for specific tasks, like SPSS for statistical analysis. My experience extends to using cloud-based platforms like AWS and Google Cloud for managing and processing large datasets. My choice of tool depends on the specific needs of the analysis; for example, SQL is ideal for extracting data from relational databases, while Python offers greater flexibility for complex data manipulations and modeling.
Q 6. How do you handle ambiguity and uncertainty when solving a problem?
Handling ambiguity and uncertainty requires a structured approach. First, I clearly define the known and unknown aspects of the problem. Then, I gather as much information as possible from all available sources to reduce uncertainty. I utilize scenario planning to explore potential outcomes under different assumptions. This involves developing multiple scenarios, each with different assumptions about the unknown variables, and evaluating the potential impact of each. Sensitivity analysis helps assess the impact of changes in key variables on the solution. Finally, I make a decision based on the available information and the potential risks and rewards associated with each option. This process is iterative; as more information becomes available, the analysis and decision can be refined.
Q 7. Give an example of a time you had to make a decision with incomplete information.
During a product launch, we faced an unexpected surge in customer support requests. We lacked complete information about the root cause of the issue. However, we needed to quickly address the escalating situation. Based on initial reports and feedback, we hypothesized several potential causes: a bug in the software, insufficient server capacity, or a problem with the user interface. To make a data-driven decision, I prioritized a swift analysis of the available customer support tickets and server logs. This provided some insights. While we did not have complete information initially, we implemented a multi-pronged approach: deploying a hotfix addressing the most likely software bug, scaling up server resources, and making temporary changes to the user interface. By combining immediate action with continuous monitoring and data collection, we successfully mitigated the issue, even with incomplete information initially. The subsequent root cause analysis informed improvements for future releases.
Q 8. How do you approach a problem you’ve never encountered before?
Facing an unfamiliar problem is an opportunity for learning and growth. My approach involves a structured process: First, I thoroughly define the problem, breaking it down into smaller, manageable components. This helps me understand its scope and identify key variables. Then, I leverage my existing knowledge base, searching for similar problems or related concepts. This might involve research, consulting relevant documentation, or brainstorming with colleagues. If necessary, I’ll experiment with different approaches, testing hypotheses and iteratively refining my understanding. Think of it like assembling a puzzle – you begin by sorting the pieces (defining the problem), then look for patterns and familiar shapes (leveraging existing knowledge), and finally fit them together (experimentation and refinement), constantly evaluating the progress. This iterative process allows me to learn from my mistakes and improve my solution over time.
Q 9. Describe your process for evaluating potential solutions.
Evaluating potential solutions requires a critical and systematic approach. I use a multi-faceted process, starting with feasibility analysis: Can this solution be implemented given time, resources, and constraints? Next, I assess its effectiveness: How well does it address the core problem and its sub-components? Then I consider its efficiency: Is this solution the most resource-optimal approach? Finally, I evaluate its potential risks and side effects. A simple cost-benefit analysis, often aided by quantitative data if possible, helps prioritize solutions. For example, if we’re optimizing a website’s loading speed, I’d compare different solutions – like image compression versus caching – based on their impact on loading time, user experience, development cost, and maintenance requirements. The solution maximizing positive impact while minimizing negative aspects wins.
Q 10. How do you ensure the accuracy of your analysis?
Ensuring accuracy in my analysis is paramount. I employ several strategies. First, I meticulously verify data sources, ensuring their reliability and validity. I cross-reference information from multiple sources whenever possible. Second, I use appropriate analytical tools and techniques – statistical methods, data visualization, etc. – to minimize bias and enhance accuracy. Third, I conduct thorough peer reviews or seek feedback from others. A fresh perspective often highlights potential blind spots. For instance, when analyzing market trends, I’d verify data from several reputable research firms, apply statistical models to account for outliers and uncertainties, and finally discuss my findings with colleagues to ensure I haven’t overlooked key factors. Rigorous validation and multiple checks are essential to minimize errors.
Q 11. How do you communicate your findings to a non-technical audience?
Communicating complex findings to a non-technical audience necessitates clear, concise, and engaging communication. I avoid technical jargon whenever possible, opting for simple language and relatable analogies. Visual aids like charts and graphs significantly enhance understanding. I focus on explaining the ‘so what?’ – the implications of the findings and their relevance to the audience. Imagine explaining the results of a complex data analysis on customer behavior to the marketing team: Instead of discussing statistical significance, I’d focus on actionable insights like ‘Customers in this demographic are 30% more likely to purchase product X’ and visualize this with a simple bar chart, focusing on the business impact.
Q 12. Explain a time you had to work collaboratively to solve a problem.
In a previous project involving the optimization of a supply chain, I collaborated closely with engineers, logistics specialists, and data analysts. We faced a challenge in reducing delivery times while minimizing costs. My role involved analyzing the data, identifying bottlenecks in the current process, and proposing alternative solutions. The engineers provided technical feasibility assessments, the logistics team reviewed the practicality of implementing proposed changes, and the data analysts helped monitor and measure the results. Through regular meetings, open communication, and a shared commitment to success, we effectively implemented a new routing algorithm which significantly improved efficiency and reduced delivery times by 15%. This demonstrates the value of diverse perspectives and collaborative problem solving.
Q 13. How do you handle criticism or feedback on your work?
I view criticism and feedback as invaluable opportunities for learning and improvement. I approach it with an open mind, actively listening to the feedback and seeking to understand its underlying reasons. I analyze the constructive aspects of the criticism, asking myself where I can improve my methods or approach. I’m also mindful of separating the message from the messenger – the aim is to understand the feedback, not react defensively. For example, if someone suggests my analysis lacked sufficient detail, I would carefully examine my report, add the necessary context and supporting data, and ensure future analyses address this feedback. Continuous learning and improvement are crucial in my field.
Q 14. Describe a situation where you had to adapt your approach to a problem.
During a project involving predictive modeling, our initial approach using a complex algorithm proved computationally expensive and difficult to implement. While the accuracy was high, the time constraints made it impractical. We had to adapt our approach. We decided to use a simpler model with slightly reduced accuracy but significantly improved processing speed. This required a trade-off between accuracy and practicality, but ultimately proved a far more effective solution given the time and resource constraints. The project successfully met its deadline and provided valuable insights. This experience highlighted the importance of flexibility and adaptability in problem-solving. Sometimes, an ‘almost perfect’ solution delivered on time is better than a ‘perfect’ solution delivered too late.
Q 15. How do you stay organized and manage your workload effectively?
Effective workload management is crucial for success. My approach is multifaceted, combining proactive planning with flexible adaptation. I begin by prioritizing tasks using methods like Eisenhower Matrix (urgent/important), which helps me focus on high-impact activities first. I then break down large projects into smaller, manageable chunks, creating detailed to-do lists with deadlines. I utilize digital tools like project management software (e.g., Asana, Trello) to track progress, deadlines, and dependencies. Regular review and adjustment are key; I allocate specific times for reviewing my schedule and re-prioritizing as needed. This allows me to adapt to unexpected changes and maintain a steady workflow. For example, if a critical issue arises, I’ll adjust my schedule to address it immediately, re-prioritizing tasks to maintain overall project goals.
- Prioritization Techniques: Eisenhower Matrix, MoSCoW method
- Tools: Project management software (Asana, Trello, Monday.com), digital calendars
- Regular Review: Daily/weekly check-ins to assess progress and adjust accordingly
Career Expert Tips:
- Ace those interviews! Prepare effectively by reviewing the Top 50 Most Common Interview Questions on ResumeGemini.
- Navigate your job search with confidence! Explore a wide range of Career Tips on ResumeGemini. Learn about common challenges and recommendations to overcome them.
- Craft the perfect resume! Master the Art of Resume Writing with ResumeGemini’s guide. Showcase your unique qualifications and achievements effectively.
- Don’t miss out on holiday savings! Build your dream resume with ResumeGemini’s ATS optimized templates.
Q 16. How do you identify and mitigate potential risks?
Risk mitigation involves proactively identifying potential problems and developing strategies to minimize their impact. My process starts with a thorough risk assessment. I identify potential risks through brainstorming sessions, reviewing past project experiences, and considering industry best practices. I use a structured approach, often employing a risk matrix that assesses both the likelihood and potential impact of each risk. This helps to prioritize which risks require the most attention. Mitigation strategies are then developed for each identified risk, ranging from avoidance (eliminating the risk altogether) to mitigation (reducing the likelihood or impact), transfer (insuring against the risk), or acceptance (accepting the risk and its potential consequences). For instance, in a software development project, I might identify a risk of delayed third-party API integration. My mitigation strategy would include early communication with the API provider, establishing clear communication channels, and building in contingency plans (e.g., using a temporary alternative solution).
- Risk Assessment: Brainstorming, reviewing past projects, industry best practices
- Risk Matrix: Likelihood vs. Impact
- Mitigation Strategies: Avoidance, Mitigation, Transfer, Acceptance
Q 17. Describe a time you failed to solve a problem. What did you learn?
During a past project, we underestimated the complexity of integrating a legacy system with a new application. Our initial solution, a direct data transfer, proved inefficient and prone to errors. We missed crucial deadlines and the project suffered from significant delays. The failure taught me the importance of thorough upfront analysis. We should have invested more time in thoroughly understanding the legacy system’s architecture and data structure, potentially employing a phased integration approach. Learning from this, I now always emphasize a more detailed investigation of existing systems and potential integration challenges, including thorough testing and contingency planning before implementing any solution.
- Lesson Learned: Importance of thorough upfront analysis and phased integration.
- Improved Approach: Detailed investigation of legacy systems, phased implementation, rigorous testing.
Q 18. How do you use logic and reasoning to solve problems?
Logic and reasoning are fundamental to problem-solving. I employ deductive and inductive reasoning, often in combination. Deductive reasoning starts with general principles and moves towards specific conclusions. For example, knowing that all squares are rectangles (general principle), I can deduce that a specific shape, which is a square, is also a rectangle (specific conclusion). Inductive reasoning moves from specific observations to broader generalizations. If I observe that several samples of a particular mineral all exhibit a certain characteristic, I might inductively reason that all samples of that mineral likely possess that characteristic. In problem-solving, I use these methods to break down complex problems into smaller, manageable parts, identify patterns, and eliminate possibilities. For example, troubleshooting a computer issue might involve deductive reasoning (if the computer won’t boot, it could be a hardware or software problem) and inductive reasoning (based on previous similar issues, the cause might be a faulty RAM module).
Q 19. What is your preferred method for gathering and evaluating information?
My preferred method for gathering and evaluating information involves a multi-pronged approach that prioritizes both breadth and depth. I begin by identifying reliable sources and employing a combination of techniques: researching relevant literature, consulting experts in the field, conducting interviews, and analyzing data (e.g., statistical data, case studies). I critically evaluate information by considering the source’s credibility, checking for bias, and verifying the information from multiple sources. To structure this process, I use techniques like SWOT analysis to identify strengths, weaknesses, opportunities, and threats related to the information. Additionally, I employ techniques such as root cause analysis to uncover the underlying causes of issues or problems.
- Information Sources: Literature reviews, expert consultation, interviews, data analysis
- Evaluation Techniques: Source credibility assessment, bias detection, cross-referencing
- Analytical Frameworks: SWOT analysis, root cause analysis
Q 20. How do you deal with conflicting priorities?
Conflicting priorities are a common challenge. My approach focuses on clear communication and prioritization. I begin by openly discussing the conflicting priorities with relevant stakeholders to understand the importance and urgency of each task. Then, I employ prioritization techniques such as the Eisenhower Matrix or MoSCoW method (Must have, Should have, Could have, Won’t have) to determine the most critical tasks. I might also negotiate deadlines or delegate tasks where appropriate. Transparent communication ensures everyone understands the rationale behind the prioritization decisions, preventing misunderstandings and building consensus. For example, if facing a deadline for project A and a high-priority request for project B, I’d openly discuss this conflict with the project managers, explain my proposed prioritization (perhaps based on the impact of delay), and negotiate possible adjustments if needed.
Q 21. Describe a time you used critical thinking to solve a problem.
In a previous project, we faced unexpected system downtime. Initial troubleshooting suggested a server hardware failure, but restoring the system from backup failed to resolve the issue. Using critical thinking, I systematically reviewed the logs and network monitoring data, looking for patterns. I noticed unusual network traffic just before the outage, indicating a potential external attack, which wasn’t our initial hypothesis. Further investigation revealed a Distributed Denial of Service (DDoS) attack. By shifting our focus from hardware to network security, we identified the true root cause. Implementing mitigation strategies (e.g., network filtering, load balancing) effectively addressed the problem and prevented future occurrences. This experience highlighted the importance of considering a broader range of possibilities and using data-driven analysis to solve complex problems.
Q 22. How do you ensure your solutions are both efficient and effective?
Ensuring solutions are both efficient and effective involves a careful balance between speed and thoroughness. Efficiency focuses on minimizing resource consumption (time, cost, effort), while effectiveness centers on achieving the desired outcome. I approach this by first clearly defining the problem and the desired outcome. This involves understanding the constraints and priorities. Then, I explore multiple solutions, evaluating each based on its efficiency (speed of implementation, resource use) and effectiveness (likelihood of achieving the goal). This might involve creating a simple cost-benefit analysis or using a decision matrix to weigh the pros and cons of each approach. For example, if tasked with improving website load times, a purely efficient solution might involve simply reducing image sizes, sacrificing quality. A more effective (and potentially less efficient initially) solution might be to optimize the server-side code and database queries, leading to longer-term improvements in speed and user experience. The optimal solution is often a compromise, finding the sweet spot between the two.
Q 23. What strategies do you use to manage your time effectively under pressure?
Managing time under pressure requires a structured approach. My strategy involves prioritizing tasks using methods like the Eisenhower Matrix (urgent/important), then breaking down large tasks into smaller, manageable chunks. This allows me to focus on the most critical items first. I utilize time-blocking techniques, allocating specific time slots for focused work, minimizing distractions. Regular breaks are crucial to maintain concentration and prevent burnout. Finally, I proactively communicate potential delays or roadblocks to stakeholders to manage expectations. For example, during a project deadline crunch, I’d identify the most critical path activities, focusing my energy there. I’d delegate tasks where appropriate, and regularly check in with team members to ensure we are on track.
Q 24. Explain your approach to problem-solving using the STAR method.
The STAR method (Situation, Task, Action, Result) is a fantastic framework for structuring problem-solving narratives. Let me illustrate with an example:
Situation: Our team noticed a significant drop in customer satisfaction scores related to our new online ordering system.
Task: My task was to identify the root cause of this decline and recommend solutions to improve customer experience.
Action: I started by analyzing customer feedback data, identifying common complaints. This involved qualitative analysis of open-ended comments and quantitative analysis of rating scores. I then conducted user interviews to gather more in-depth information directly from the customers, observing their interactions with the system. Based on this data, I identified a key issue: the system’s navigation was confusing and slow. I proposed solutions: re-designing the navigation to be more intuitive and optimizing the system’s backend for faster loading times.
Result: After implementing the proposed changes, customer satisfaction scores significantly improved, resulting in a marked increase in positive reviews and repeat business. This demonstrated the effectiveness of my problem-solving approach and the importance of thorough data analysis and user-centric design.
Q 25. How do you use data visualization to present your findings?
Data visualization is crucial for communicating insights effectively. My approach depends on the audience and the data. I select appropriate chart types to effectively present the data: bar charts for comparisons, line charts for trends over time, scatter plots for correlations, pie charts for proportions, and heatmaps for showing relationships across multiple variables. I strive for clarity and simplicity, avoiding unnecessary clutter or complex charts. I use clear and concise labels, and an appropriate scale. Tools like Tableau or Power BI allow for interactive dashboards, empowering the audience to explore the data further. For example, instead of simply presenting a table of sales figures, I would use a geographical heatmap to visualize sales performance across different regions, instantly highlighting areas of success and areas needing attention. This visual representation makes the information far more readily understandable and actionable.
Q 26. Explain your understanding of statistical analysis.
Statistical analysis provides tools to understand data patterns and draw meaningful conclusions. My understanding encompasses descriptive statistics (summarizing data through measures like mean, median, standard deviation), inferential statistics (drawing conclusions about a population based on a sample, using hypothesis testing, confidence intervals), and regression analysis (examining the relationship between variables). I’m proficient in various statistical software packages (R, SPSS, etc.) and use the appropriate techniques based on the nature of the data and the research question. For example, I might use a t-test to compare the average performance of two different marketing campaigns, or perform a regression analysis to predict sales based on advertising spend. Understanding the assumptions and limitations of each statistical method is crucial for drawing valid conclusions.
Q 27. Describe a time you identified an opportunity for process improvement.
In a previous role, we were experiencing significant delays in the processing of customer orders. I noticed that the order processing system involved multiple manual steps, leading to bottlenecks and errors. I identified an opportunity for process improvement by automating several of these steps using a workflow management system. This involved mapping out the current process, identifying redundant steps, and designing a streamlined workflow. After implementing the automated system, order processing time decreased by 40%, significantly reducing errors and improving customer satisfaction. This example highlights my proactive approach to identifying inefficiencies and implementing data-driven solutions for optimization.
Q 28. How do you use quantitative and qualitative data in your analysis?
Quantitative and qualitative data provide complementary insights. Quantitative data (numerical data) provides objective measurements and allows for statistical analysis. Qualitative data (textual or observational data) offers rich contextual information and understanding of underlying reasons. I use both in a mixed-methods approach to gain a comprehensive understanding. For example, in analyzing customer feedback on a product, quantitative data might include ratings and numerical scores, while qualitative data would include written comments and interview transcripts. By combining these, I can identify both the extent of a problem (quantitative) and the underlying reasons for it (qualitative), leading to more effective solutions. A purely quantitative analysis of low ratings might not reveal the root cause of customer dissatisfaction, whereas incorporating qualitative feedback can help pinpoint areas needing improvement.
Key Topics to Learn for Analytical Thinking and Problem-Solving Abilities Interview
- Critical Thinking & Logical Reasoning: Understanding the underlying structure of a problem, identifying biases, and formulating sound arguments. Practical application: Analyzing data sets to identify trends and draw meaningful conclusions.
- Data Analysis & Interpretation: Extracting insights from various data sources (numerical, textual, visual). Practical application: Using statistical methods to support your conclusions and presenting findings clearly.
- Problem Decomposition & Structuring: Breaking down complex problems into smaller, manageable parts. Practical application: Developing a step-by-step plan to address a challenge, prioritizing tasks effectively.
- Solution Design & Evaluation: Generating multiple solutions, evaluating their feasibility and effectiveness, and selecting the optimal approach. Practical application: Presenting your proposed solution clearly, justifying your choices with logical reasoning.
- Communication & Collaboration: Articulating your thought process clearly and concisely, working effectively with others to solve problems. Practical application: Participating in brainstorming sessions, presenting your analysis to a diverse audience.
- Scenario-Based Problem Solving: Applying analytical skills to real-world scenarios and unpredictable situations. Practical application: Practicing case studies and situational questions to develop your problem-solving agility.
Next Steps
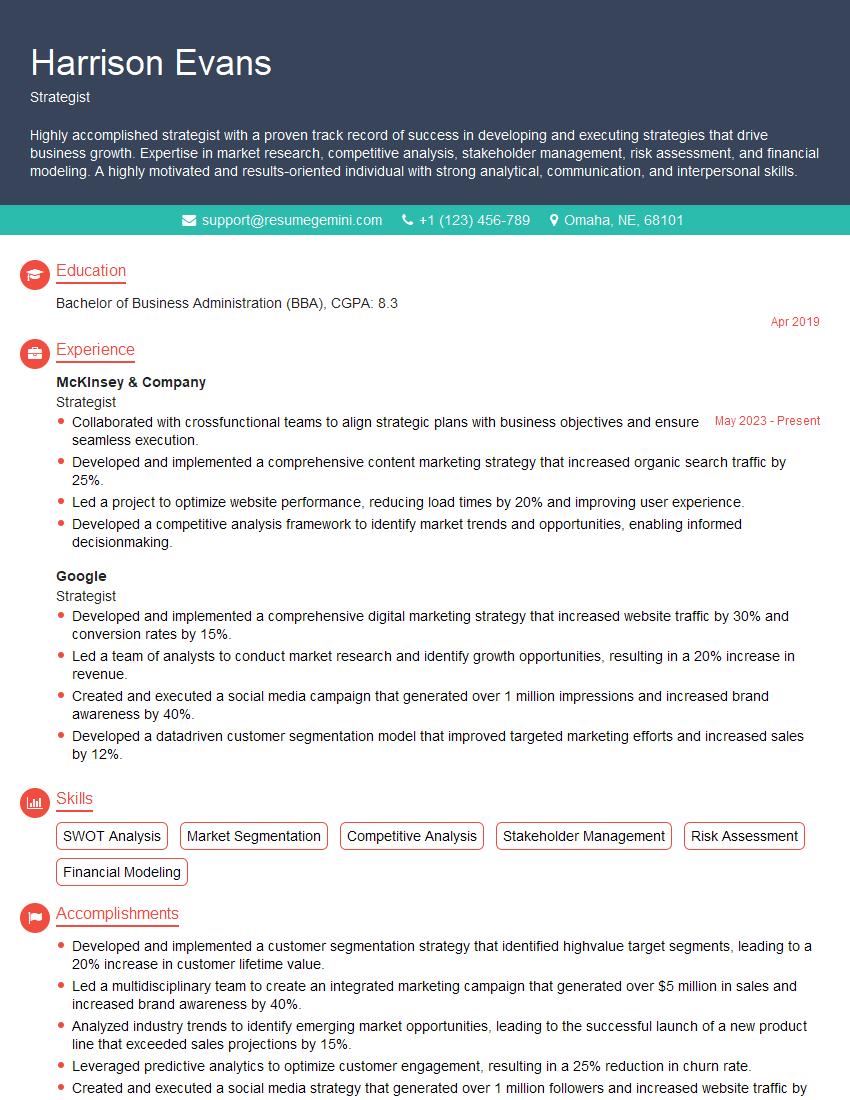
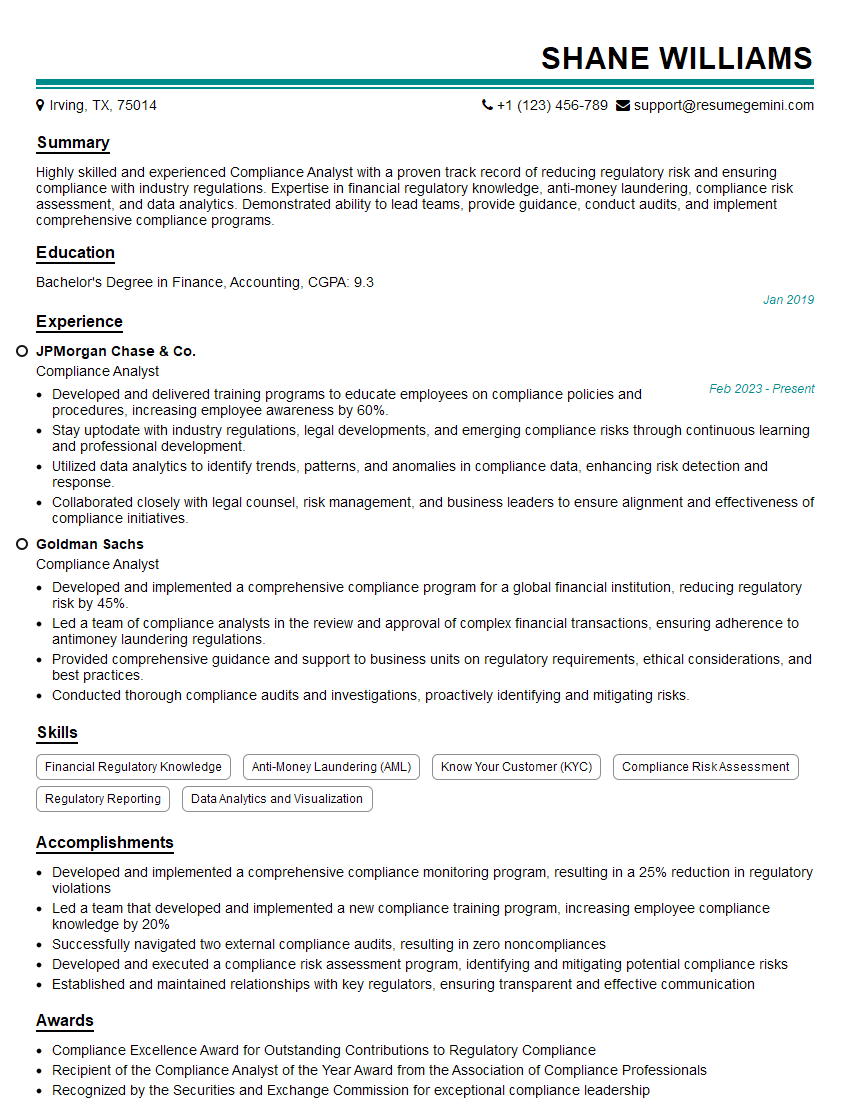
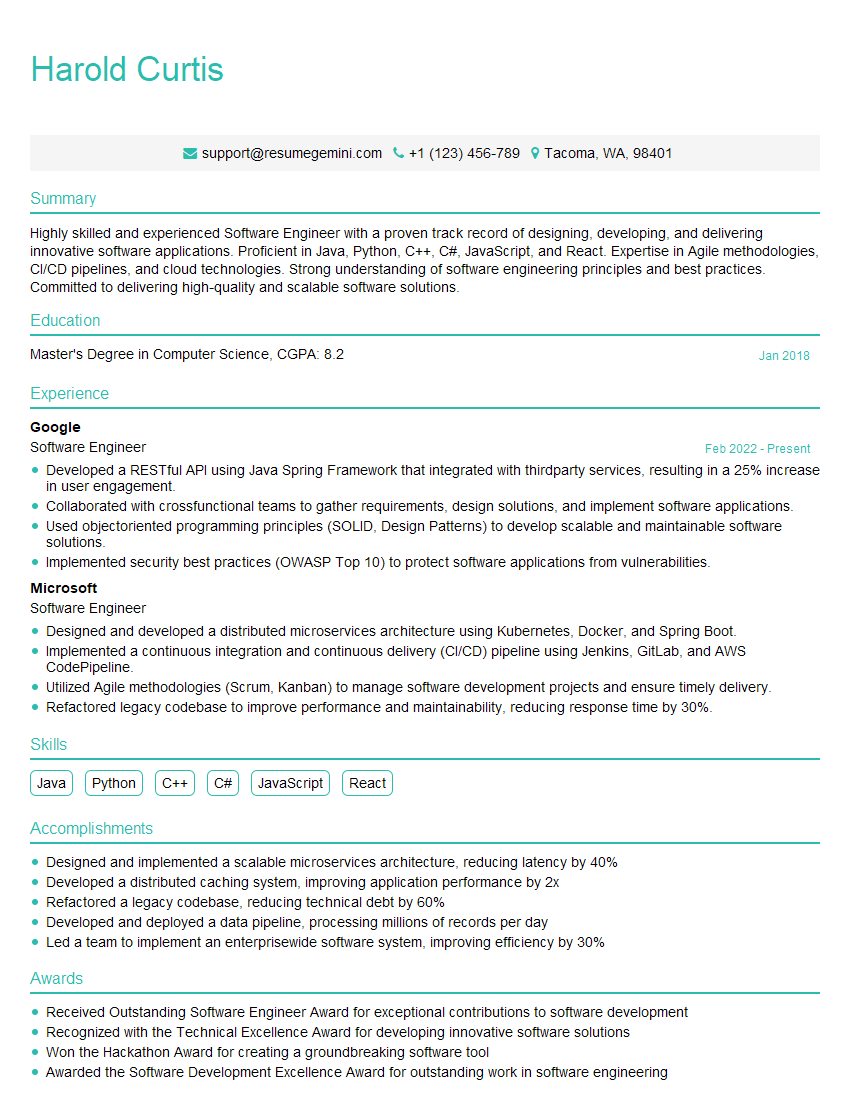
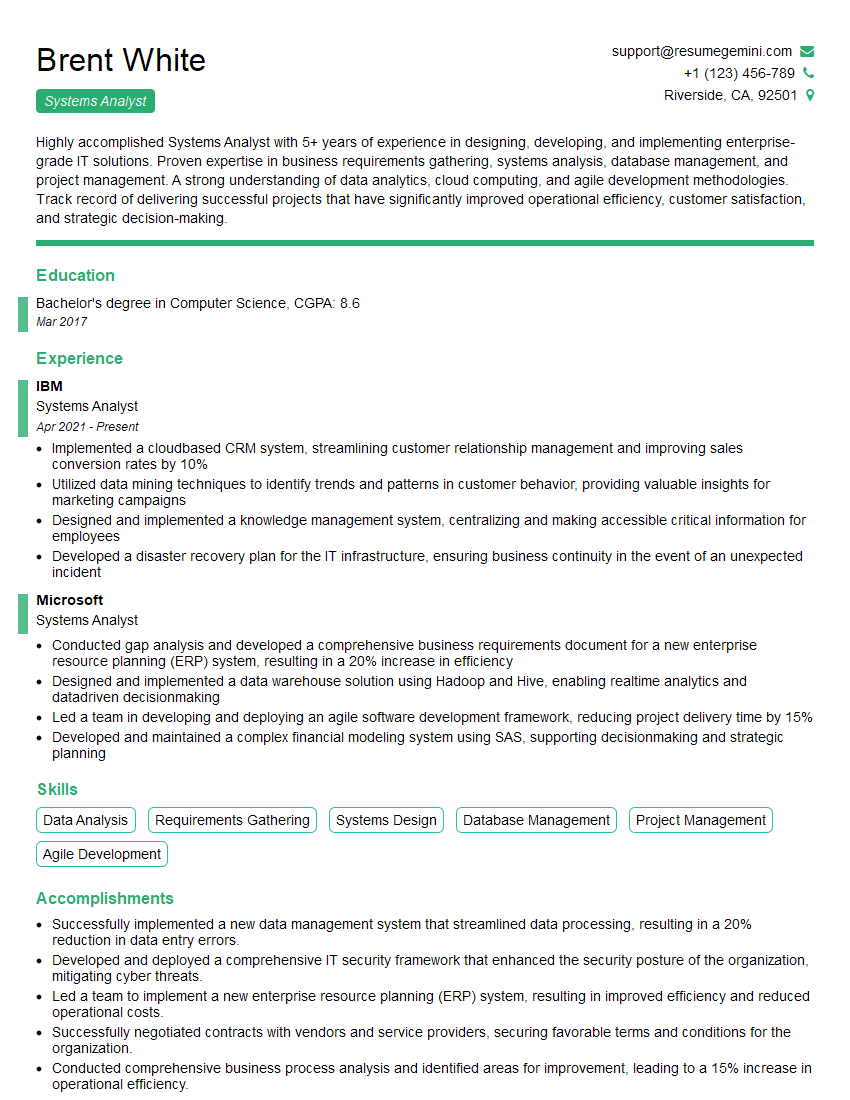
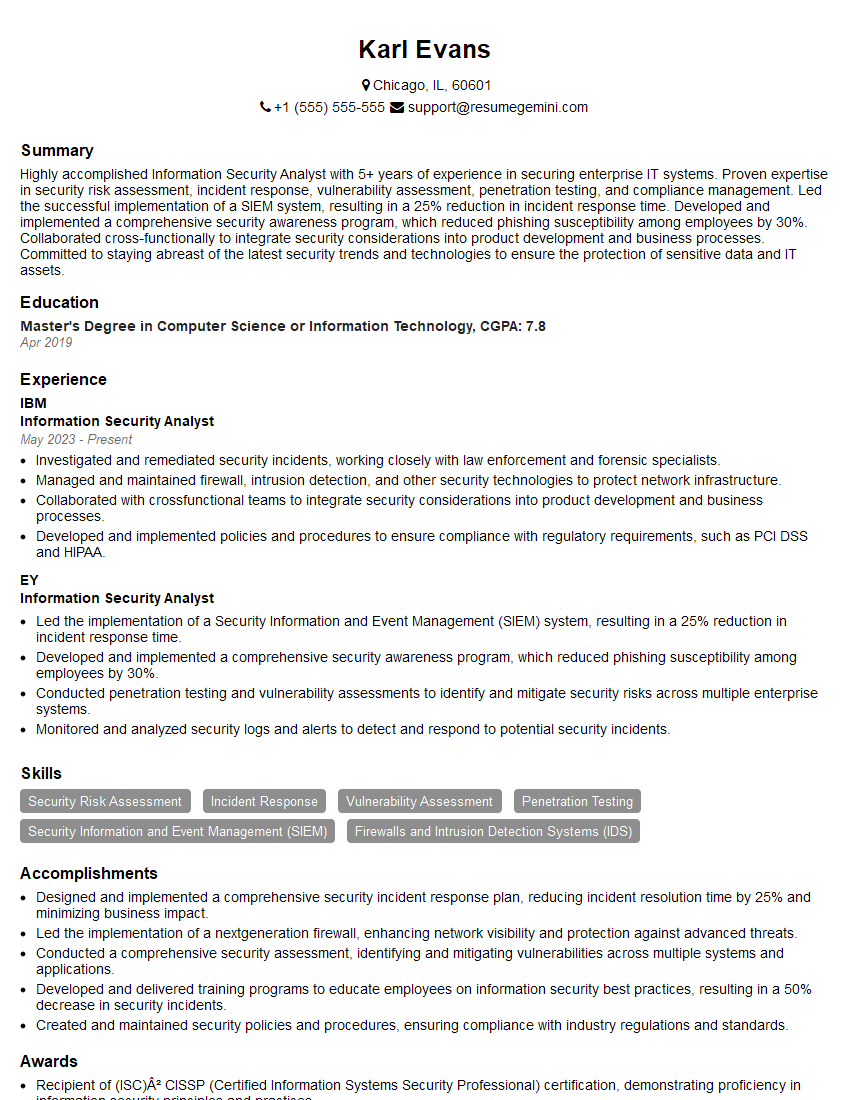
Mastering analytical thinking and problem-solving abilities is crucial for career advancement across virtually every field. These skills demonstrate your ability to navigate complexity, make informed decisions, and contribute significantly to your team’s success. To maximize your job prospects, crafting a compelling and ATS-friendly resume is vital. ResumeGemini is a trusted resource to help you build a professional resume that showcases your capabilities effectively. We provide examples of resumes tailored to highlight analytical thinking and problem-solving skills, helping you present yourself as the ideal candidate.
Explore more articles
Users Rating of Our Blogs
Share Your Experience
We value your feedback! Please rate our content and share your thoughts (optional).
What Readers Say About Our Blog
Hi, I’m Jay, we have a few potential clients that are interested in your services, thought you might be a good fit. I’d love to talk about the details, when do you have time to talk?
Best,
Jay
Founder | CEO

