Every successful interview starts with knowing what to expect. In this blog, we’ll take you through the top Presentation Tools (e.g., PowerPoint, Prezi, Google Slides) interview questions, breaking them down with expert tips to help you deliver impactful answers. Step into your next interview fully prepared and ready to succeed.
Questions Asked in Presentation Tools (e.g., PowerPoint, Prezi, Google Slides) Interview
Q 1. What are the key differences between PowerPoint, Google Slides, and Prezi?
PowerPoint, Google Slides, and Prezi are all presentation tools, but they differ significantly in their approach and functionality. PowerPoint, a Microsoft product, is the industry standard, known for its robust features, extensive template library, and offline capabilities. It’s excellent for creating structured, linear presentations.
Google Slides, part of the Google Workspace suite, excels in collaborative features. Its cloud-based nature allows for real-time co-editing and easy sharing. It’s simpler to use than PowerPoint but may lack some advanced features.
Prezi, on the other hand, uses a non-linear, zoom-based approach. Instead of traditional slide transitions, Prezi allows you to zoom in and out of a central canvas, creating a more dynamic and engaging experience. While visually striking, this can sometimes be less organized and harder to navigate than linear presentations. The choice depends on the specific needs of the presentation – a formal business presentation might suit PowerPoint best, while a creative brainstorming session could benefit from Prezi’s dynamic nature, and a collaborative project would leverage Google Slides effectively.
Q 2. Explain your experience using animation and transitions in presentations.
Animation and transitions are crucial for creating engaging presentations. My approach involves using them judiciously – overusing them can be distracting. I prioritize clarity and flow. For example, I might use a subtle fade-in transition between slides to maintain a smooth visual rhythm. Animations should highlight key information, not obscure it. I prefer using animations to draw attention to bullet points or charts as they appear, rather than using overly complex or flashy effects. I often use PowerPoint’s ‘Appear’ animation for bullet points and carefully choreograph more complex animations in Prezi to guide the viewer’s eye through the presentation’s narrative. For instance, in a presentation on project timelines, I’d animate the timeline elements to appear sequentially, illustrating the project’s progression visually.
Q 3. How would you create a visually appealing presentation with limited design resources?
Creating a visually appealing presentation with limited resources hinges on strong design principles rather than expensive software or assets. I focus on using a consistent color palette, perhaps derived from a single, striking image or brand guidelines. I leverage high-quality, free-to-use images from reputable sources like Unsplash or Pexels. Simple, clean fonts like Arial or Calibri are preferred over ornate ones. White space is a powerful tool—it allows the content to breathe and avoids a cluttered feel. Using strong visual hierarchy (larger headings, clear bullet points) makes the information easily digestible. For example, instead of using complex charts, I might use a simple bar chart enhanced with contrasting colors to highlight key data points.
Q 4. Describe your process for creating effective charts and graphs in presentations.
My process for creating effective charts and graphs begins with understanding the data and the message I want to convey. I choose the right chart type for the data – a bar chart for comparisons, a line chart for trends, a pie chart for proportions. I ensure the data is clearly labeled and easy to understand, avoiding unnecessary clutter. I use a consistent color scheme, and I keep the design simple and clean, focusing on highlighting key findings. I always check for accuracy and avoid manipulating the data to skew the results. In a presentation for investors, for instance, I’d use a clean, easily understandable bar chart to compare the company’s performance against its competitors, highlighting key metrics in a concise way.
Q 5. How do you ensure accessibility in your presentations for diverse audiences?
Accessibility is paramount. I use sufficient color contrast to ensure readability for color-blind individuals. I provide alt text for all images, describing their content for visually impaired users using screen readers. I use clear and concise language, avoiding jargon, and I use a consistent font size that’s easily readable. For presentations with audio, I provide transcripts. I also ensure that the presentation design adheres to WCAG (Web Content Accessibility Guidelines) standards for digital accessibility. For example, ensuring sufficient color contrast is crucial, which can be tested using online color contrast checkers.
Q 6. What are your preferred methods for incorporating multimedia (video, audio) into presentations?
I prefer to use high-quality multimedia, ensuring that videos and audio clips are relevant and enhance, not distract from, the presentation’s core message. Videos should be short, focused, and high-resolution. Audio should be clear and easy to understand. I always embed multimedia elements directly into the presentation rather than relying on external links, to ensure a seamless viewing experience. I test the multimedia elements thoroughly before the presentation to ensure they play smoothly and don’t cause technical issues. In a presentation about a new product, for example, I might embed a short demonstration video showcasing its features.
Q 7. How do you handle feedback and revisions on presentation designs?
Handling feedback is a collaborative process. I actively solicit feedback and treat it as an opportunity for improvement. I listen carefully to the feedback, clarify any misunderstandings, and then revise the presentation accordingly. I use version control (saving different versions of the presentation) to track changes. I respond promptly to feedback, explaining my rationale for any changes or decisions made. I iterate based on the feedback, ensuring that the final presentation meets the client’s or audience’s needs and expectations. A constructive feedback loop is vital for improving the presentation’s quality and ensuring its success.
Q 8. Describe your experience with presentation templates and themes.
Presentation templates and themes are foundational elements that significantly impact the visual appeal and overall effectiveness of a presentation. A template provides a pre-designed structure, including layouts for slides, placeholders for text and images, and a consistent color palette. A theme, often built into the template, defines the stylistic choices, such as fonts, colors, and background designs. My experience spans utilizing templates and themes across PowerPoint, Google Slides, and Prezi, tailoring them to various projects and branding guidelines.
For example, I’ve used minimalist templates for technical presentations to emphasize data clarity, while opting for more visually engaging templates with impactful imagery for marketing pitches. I’m proficient in customizing existing templates—adjusting font sizes, color schemes, and layout elements—to perfectly align with the presentation’s specific message and audience.
I also have experience creating custom templates from scratch when existing options don’t meet project requirements. This involves establishing a consistent design language, ensuring ease of use for future presentations, and integrating brand assets for cohesive branding.
Q 9. How do you maintain consistency in branding across multiple presentations?
Maintaining brand consistency across multiple presentations is crucial for professional image building. This involves developing a comprehensive brand style guide that dictates specific aspects like logo usage, color palette, typography, and imagery style. This guide then serves as the blueprint for every presentation.
In practice, I meticulously follow this style guide, ensuring the logo is used appropriately (size, placement), colors remain consistent across all slides, and fonts are uniform. I often create master slide templates or utilize the branding features within presentation software to automatically apply these consistent elements across all slides. For instance, if the brand uses a specific shade of blue, I’ll define it in the template and then use that predefined color throughout the presentation.
Furthermore, I carefully select imagery that aligns with the brand’s visual identity—maintaining a consistent style and feel. Finally, I always review the final presentation for any inconsistencies before delivery, ensuring a completely polished and branded final product.
Q 10. What strategies do you use to create engaging and memorable presentations?
Creating engaging and memorable presentations involves a blend of design principles, storytelling techniques, and audience understanding. I start by crafting a compelling narrative – a story that connects with the audience on an emotional level and guides them through the information. This isn’t just about presenting facts; it’s about painting a picture.
Visually, I employ a variety of techniques: using high-quality images and minimal text, incorporating interactive elements where appropriate, and employing strategic use of animation and transitions (avoiding overuse, which can be distracting). I also structure the presentation to maintain a strong pace, avoiding information overload on any single slide. Think of it like a well-paced movie—keeping the audience engaged from beginning to end.
For instance, I might use a compelling anecdote at the start to hook the audience or incorporate a short, relevant video clip to break up text-heavy sections. I also use data visualization techniques—charts and graphs—to present complex information in a clear and concise manner. The key is to find a balance between captivating visuals and clear, concise messaging.
Q 11. Explain your process for organizing and structuring complex information in a presentation.
Organizing and structuring complex information is key to effective presentations. I typically begin by outlining the main points and sub-points, creating a logical flow that builds upon the information presented. This outline serves as a roadmap, ensuring a coherent and easy-to-follow narrative.
Next, I use a hierarchical approach: I start with a high-level overview, gradually delving into specifics. I strategically use headings, subheadings, bullet points, and visuals to break down complex information into digestible chunks. Each slide focuses on a single key concept, avoiding information overload.
For instance, for a presentation on a complex project, I’d begin with an executive summary highlighting key milestones and outcomes. Subsequent slides would then delve into specific phases of the project, using visuals like Gantt charts or flow diagrams to illustrate the process. Always keeping the overall narrative in mind helps in maintaining the flow of information and preventing the audience from feeling lost.
Q 12. How do you tailor your presentation style to different audiences and contexts?
Tailoring presentation style to different audiences and contexts is essential for effective communication. I adapt my approach by considering the audience’s background knowledge, level of expertise, and interests. For a technical audience, I might include detailed data and jargon; for a non-technical audience, I’d simplify the language and focus on high-level concepts and compelling visuals.
The context also plays a crucial role. A formal presentation to a board of directors demands a more polished and structured approach than a casual presentation to a team. I adjust the tone, visual style, and level of detail accordingly. For example, I might use more formal language and a professional design template for a board presentation, whereas a more informal presentation might incorporate interactive elements or a conversational tone.
Ultimately, the goal is to connect with the audience on their level, making the presentation relevant and engaging for everyone present. This requires careful planning and consideration of the specific needs and expectations of the target audience.
Q 13. What are some best practices for using visuals effectively in presentations?
Effective use of visuals is crucial for engaging audiences and conveying information clearly. I prioritize high-quality images and graphics that are relevant and support the presentation’s message. I avoid cluttered slides, opting instead for a minimalist design that emphasizes key information. Visuals should enhance, not distract, from the core message.
I use various types of visuals, such as charts and graphs to illustrate data, images to showcase concepts, and videos to add dynamic elements. I ensure the visuals are appropriately sized, well-labeled, and easy to understand. For example, I might use a simple bar chart to compare data points rather than a complex pie chart that can be difficult to interpret quickly.
Importantly, I always cite the source of any images or data used to maintain credibility and avoid copyright issues. The visuals should be consistent with the overall brand and presentation theme, reinforcing a cohesive and professional image.
Q 14. How familiar are you with different presentation delivery methods (e.g., in-person, virtual)?
I am highly familiar with various presentation delivery methods, including in-person and virtual presentations. In-person presentations require strong public speaking skills, effective use of body language, and the ability to gauge audience engagement in real-time. I’m comfortable adapting my delivery based on audience feedback.
For virtual presentations, I leverage technology effectively. I’m proficient in using tools like Zoom and WebEx, understanding the nuances of presenting to a remote audience. This includes strategies for maintaining engagement through interactive elements, using clear audio and video, and proactively addressing any technological challenges. I am also experienced in recording and editing presentations for asynchronous delivery, ensuring high-quality audio and video.
Regardless of the delivery method, I prioritize clear communication, a strong narrative, and engaging visuals to ensure the message is effectively conveyed to the audience. I adapt my approach to optimize the experience for the chosen platform and audience.
Q 15. Describe your experience using collaboration tools for presentation development.
Collaboration is paramount in presentation development. My experience spans various tools like Google Slides, PowerPoint, and even Prezi, leveraging their collaborative features extensively. For instance, with Google Slides, I frequently utilize the real-time co-editing feature, allowing multiple team members to work concurrently on a single presentation. This significantly streamlines the process, fostering simultaneous brainstorming and content refinement. In PowerPoint, I often utilize the ‘Share’ feature, enabling feedback and revision cycles. Prezi’s collaborative features are less robust, so we often resort to cloud storage solutions for version control and shared access. Effective communication throughout the collaborative process is key—clear roles, consistent communication, and regularly scheduled check-ins ensure everyone remains aligned and the final product reflects the team’s collective vision. For example, in a recent marketing campaign, our team used Google Slides’ commenting feature to provide detailed feedback on individual slides before finalizing the presentation.
Career Expert Tips:
- Ace those interviews! Prepare effectively by reviewing the Top 50 Most Common Interview Questions on ResumeGemini.
- Navigate your job search with confidence! Explore a wide range of Career Tips on ResumeGemini. Learn about common challenges and recommendations to overcome them.
- Craft the perfect resume! Master the Art of Resume Writing with ResumeGemini’s guide. Showcase your unique qualifications and achievements effectively.
- Don’t miss out on holiday savings! Build your dream resume with ResumeGemini’s ATS optimized templates.
Q 16. How do you manage large datasets for use in impactful presentations?
Managing large datasets for impactful presentations requires careful planning and visualization techniques. The key is not to overwhelm the audience with raw data; instead, focus on extracting meaningful insights and presenting them visually. I start by identifying the key takeaways from the data – what story are we trying to tell? Then, I use tools like Excel or data visualization software (e.g., Tableau) to pre-process and aggregate the data, focusing on relevant metrics and trends. For presentations, I avoid cramming charts with excessive detail. Instead, I might utilize summary charts, graphs, and infographics to highlight key trends. For example, instead of showing a table of thousands of sales figures, I’d use a line graph to show overall sales trends over time, highlighting peak and low periods. I also utilize data labeling and annotation to further clarify complex datasets within the visual representation, ensuring that the data supports and enhances the narrative without overwhelming the viewer.
Q 17. What are the advantages and disadvantages of using different presentation software options?
Each presentation software has unique strengths and weaknesses. PowerPoint is ubiquitous, offering extensive customization and transition options. However, its traditional slide-based structure can sometimes limit creative freedom. Google Slides excels in collaboration and accessibility; its cloud-based nature allows for easy sharing and real-time editing, but customization options may be slightly less extensive than PowerPoint. Prezi’s zoom-based presentation style offers a visually dynamic approach, ideal for engaging audiences with a non-linear narrative, but can be less suitable for presenting highly detailed data or technical information. The choice depends on project needs. For a large team collaborating on a project with frequent revisions, Google Slides is ideal. For a highly customized, visually engaging presentation with a more linear narrative, PowerPoint is usually preferred. If I needed a truly dynamic and engaging visual experience for a marketing presentation, then Prezi would be a strong candidate.
Q 18. How do you ensure your presentations are suitable for different screen sizes and devices?
Ensuring presentation suitability across various devices is critical. I use a responsive design approach, prioritizing scalability and readability. This includes utilizing vector graphics instead of raster images wherever possible, as vectors scale without losing quality. I also avoid using overly small fonts or cluttered layouts, ensuring adequate spacing and visual hierarchy. The use of master slides in PowerPoint or theme settings in Google Slides helps to maintain consistent branding and formatting across all slides. For images, I optimize them for web use, reducing file size without compromising quality too drastically. Finally, before presenting, I preview the presentation on different devices (desktops, laptops, tablets, and phones) to identify and correct any display issues, ensuring a consistent and positive viewing experience irrespective of screen size.
Q 19. What are some common mistakes to avoid when designing presentations?
Several common mistakes should be avoided. One major issue is including too much text on slides; this overwhelms the audience and detracts from the presenter. Instead, use concise bullet points and visuals to convey information. Another is using inconsistent formatting—maintaining consistent fonts, colors, and styles throughout the presentation is essential for visual appeal and professionalism. Poor visual hierarchy—failure to highlight key information visually—makes it difficult for the audience to follow the narrative. Using low-resolution images results in a blurry, unprofessional look. And finally, neglecting to proofread for typos or grammatical errors undermines credibility. A well-designed presentation is polished, concise, and visually appealing. Remember the KISS principle: Keep It Simple, Stupid!
Q 20. Describe your workflow for creating and delivering presentations.
My workflow involves several key stages. First, I thoroughly research the topic and define the objective of the presentation—what message do I need to convey? Next, I outline the key points and structure the presentation logically. This involves creating a detailed storyboard that outlines the content and visuals for each slide. Then, I design the slides, incorporating visuals, data visualizations, and minimal text. Following this, I practice the delivery, ensuring a smooth and confident presentation. Finally, I review and refine the presentation based on feedback and practice sessions. It’s an iterative process; I often revisit and revise the content even after the initial design is complete. This iterative process ensures the presentation is both informative and engaging.
Q 21. How do you incorporate data storytelling techniques in your presentations?
Data storytelling transforms raw data into a compelling narrative. I incorporate this by framing the data within a clear context, highlighting the significance of the findings, and using visuals to emphasize key trends and patterns. For example, instead of simply presenting sales figures, I’d explain the context – e.g., a successful marketing campaign – and then use a visually appealing chart to illustrate the upward trend in sales, connecting the data to the narrative. I use metaphors and analogies to make complex data more relatable and easier to understand. A compelling narrative structure—beginning, middle, and end—keeps the audience engaged and facilitates information retention. The key is to guide the audience through a journey of discovery, revealing insights in a structured and memorable way. Data storytelling transforms data into a persuasive and impactful presentation.
Q 22. How do you use presentation software to enhance audience engagement?
Enhancing audience engagement in presentations hinges on creating a compelling narrative that resonates with the viewers. This goes beyond simply displaying information; it’s about fostering connection and interaction. I achieve this through several key strategies:
- Storytelling: I structure presentations around a clear narrative arc, using relatable anecdotes and compelling examples to illustrate key points. Instead of a dry recitation of facts, I aim to tell a story that captivates the audience and makes the information memorable.
- Visual Appeal: I leverage high-quality visuals – images, charts, and videos – to break up text-heavy slides and keep the audience visually stimulated. I ensure that the visuals are relevant, clear, and professionally designed, avoiding cluttered or distracting elements.
- Interactive Elements: Incorporating interactive elements, such as polls, quizzes, or Q&A sessions, encourages active participation and keeps the audience engaged. This allows for immediate feedback and fosters a more dynamic learning experience.
- Brevity and Clarity: I prioritize concise messaging, avoiding jargon and focusing on key takeaways. I use clear and simple language, ensuring that the information is easily understandable and avoids overwhelming the audience.
- Varied Presentation Styles: I adapt my presentation style to the audience and the context. For example, a more informal and interactive approach might be suitable for a workshop, whereas a more formal tone would be appropriate for a business presentation.
For example, during a recent presentation on sustainability initiatives, I incorporated a short video showcasing the positive impact of the company’s efforts. This visual element significantly increased audience engagement and helped to convey the message more effectively than simply presenting statistics.
Q 23. What is your approach to incorporating interactive elements into presentations?
My approach to incorporating interactive elements is multifaceted and tailored to the specific presentation goals and audience. I believe interaction is crucial for preventing passive consumption of information. Here’s how I approach it:
- Pre-Presentation Engagement: I might use online polls or surveys before the presentation to gauge audience knowledge and tailor the content accordingly. This builds anticipation and fosters a sense of community.
- In-Presentation Interaction: During the presentation, I leverage features like built-in polling tools in presentation software (like Google Slides’ Q&A feature or PowerPoint’s integrated polling options) to conduct quick polls and quizzes. I also encourage questions and discussions throughout.
- Post-Presentation Follow-up: After the presentation, I might share resources, surveys, or even create a dedicated space for ongoing discussion (e.g., a forum). This keeps the engagement going beyond the presentation itself.
- Gamification: Where appropriate, I introduce elements of gamification, such as leaderboards or points systems during quizzes, to incentivize participation and enhance the learning experience.
- Technology Integration: I’m comfortable using a variety of technologies to enhance interactivity, such as live Q&A tools, audience response systems (like Slido), and interactive whiteboards.
For instance, during a training session on new software, I used a live poll to gauge participants’ understanding of a particular feature. This helped me identify areas where further explanation was needed, ensuring everyone was on the same page.
Q 24. What experience do you have with using presentation software to create dynamic content?
I have extensive experience creating dynamic content using various presentation software. My skills encompass more than just static slides; I’m proficient in leveraging animation, transitions, multimedia integration, and interactive elements to create engaging and memorable experiences.
- PowerPoint: I’m adept at using PowerPoint’s animation features to highlight key information, create visual interest, and guide the audience’s eye through complex data. I use transitions thoughtfully to ensure smooth flow and avoid jarring effects.
- Google Slides: Google Slides’ collaborative features allow for efficient teamwork. I utilize its animation and transition capabilities, as well as its integration with other Google services, to create seamless and engaging presentations.
- Prezi: I have experience with Prezi’s zoom and pan capabilities to create visually stunning and dynamic presentations, particularly effective for showcasing complex relationships or narratives.
- Multimedia Integration: I seamlessly integrate videos, audio clips, and interactive simulations to enhance the presentation’s impact and cater to different learning styles.
In a recent project, I used Prezi’s zoom capabilities to take the audience on a ‘journey’ through the evolution of a product, starting with its initial concept and culminating in its current state. This created a visually compelling narrative that significantly enhanced audience engagement.
Q 25. Describe your understanding of visual hierarchy in presentation design.
Visual hierarchy in presentation design is critical; it’s about guiding the audience’s eye through the information in a logical and intentional way. It ensures that the most important information is immediately apparent, while less crucial details are presented in a supporting role. I achieve this by using several key techniques:
- Size and Scale: Larger text and images naturally draw more attention than smaller ones. I use this principle to emphasize key points and headlines.
- Color and Contrast: Strategic use of color can significantly impact visual hierarchy. Bright, contrasting colors draw the eye, while muted colors recede into the background. I always ensure sufficient color contrast for readability.
- Font Selection: Using different font styles and sizes creates visual distinction. Headlines typically use larger, bolder fonts, while body text uses smaller, easier-to-read fonts.
- Whitespace: Strategic use of whitespace (empty space) creates visual breathing room and helps to organize information, preventing a cluttered appearance.
- Placement: The placement of elements on the slide also impacts visual hierarchy. Elements positioned centrally or at the top tend to be seen first.
For example, in a financial report presentation, I would use a larger, bolder font for key financial figures, contrasting it with smaller text for supporting data. I would also strategically use color to highlight positive or negative trends.
Q 26. Explain your familiarity with using advanced features of presentation software (e.g., animations, transitions, hyperlinks).
I am proficient in utilizing advanced features of presentation software to enhance visual storytelling and audience engagement. This includes a deep understanding of animations, transitions, and hyperlinks, and how to use them effectively.
- Animations: I use animations subtly and purposefully to emphasize key points, reveal information gradually, and maintain audience interest. Overuse of animations can be distracting, so I prioritize thoughtful application. I often use entrance, exit, and emphasis animations in PowerPoint and Google Slides to draw attention to specific content.
- Transitions: Similar to animations, transitions should be used sparingly and strategically. I select transitions that are smooth and visually appealing, avoiding overly flashy or jarring effects. The goal is to guide the audience smoothly between slides, not to distract them.
- Hyperlinks: I effectively use hyperlinks to connect slides within a presentation, direct audiences to external resources, or embed interactive elements. This adds depth and allows for a more interactive experience.
For example, in a presentation on a new software application, I used animations to gradually reveal the steps in a particular process, enhancing understanding and retention. This helped avoid overwhelming the audience with information all at once. I also included hyperlinks to relevant documentation for deeper exploration.
Q 27. How do you incorporate audience feedback to improve future presentation designs?
Incorporating audience feedback is crucial for iterative improvement in presentation design. I actively solicit and analyze feedback to refine my approach and ensure future presentations are more impactful.
- Post-Presentation Surveys: I often use online surveys to gather feedback on content clarity, engagement levels, and areas for improvement. These surveys are tailored to the specific presentation and often include open-ended questions to capture qualitative feedback.
- Informal Feedback Sessions: I sometimes conduct informal feedback sessions with a select group of audience members to gain deeper insights and discuss specific aspects of the presentation.
- Observation and Note-Taking: During presentations, I observe audience reactions, such as body language and engagement levels. I take note of any questions or comments to understand areas where clarification or improvement is needed.
- Data Analysis: If I use interactive elements such as polls, I analyze the responses to better understand audience understanding and preferences.
- Iterative Design: Based on the feedback collected, I revise and refine future presentations, addressing any identified areas for improvement.
For example, after a presentation on a complex technical topic, audience feedback revealed that certain aspects were too technical and needed simplification. In future presentations on similar topics, I incorporated more visual aids and simplified the language to ensure better understanding.
Q 28. What are some techniques for creating visually appealing and easy-to-understand data visualizations?
Creating visually appealing and easy-to-understand data visualizations is crucial for effective communication. I use several key techniques to ensure data is presented clearly and engagingly:
- Choose the Right Chart Type: Selecting the appropriate chart type is fundamental. Bar charts are great for comparing categories, line charts for showing trends, pie charts for proportions, and scatter plots for correlations. I avoid using chart types that are inappropriate for the data being presented.
- Keep it Simple: I avoid cluttering charts with excessive data points or labels. I focus on the key insights and use clear, concise labels.
- Use Color Strategically: Color can significantly enhance data visualization, but overuse can be detrimental. I use color consistently and purposefully, employing a limited palette to avoid distraction.
- Highlight Key Findings: I use visual cues like highlighting, annotations, and callouts to draw attention to the most important findings.
- Ensure Readability: I ensure that all text and labels are legible, using an appropriate font size and color contrast.
- Data Context and Narrative: Data visualization is not just about the chart itself; it’s about how it fits into the larger narrative of the presentation. I always provide context and explain the key takeaways.
For instance, instead of presenting a complex table of sales figures, I created a line chart showing the sales trend over time, clearly highlighting key growth periods. This visual representation made it much easier for the audience to understand the data and its implications.
Key Topics to Learn for Presentation Tools (e.g., PowerPoint, Prezi, Google Slides) Interview
- Mastering the Interface: Gain a deep understanding of the user interface and navigation within PowerPoint, Prezi, and Google Slides. Practice efficient workflows and shortcut keys.
- Slide Design Principles: Learn about visual hierarchy, typography, color theory, and image selection to create impactful and professional-looking presentations. Practice creating visually appealing and easy-to-understand slides.
- Data Visualization: Explore effective ways to present data using charts, graphs, and tables. Understand how to choose the right visualization for different data types and communicate insights clearly.
- Animation and Transitions: Learn how to use animation and transitions effectively to enhance engagement without overwhelming the audience. Understand when to use them and when to keep it simple.
- Presentation Delivery and Storytelling: Practice delivering your presentations confidently and engagingly. Develop strong storytelling skills to connect with your audience and make your message memorable.
- Collaboration and Sharing: Understand how to collaborate on presentations with others using features like co-authoring and version control. Learn how to effectively share and present your work in different environments.
- Advanced Features: Explore advanced features specific to each platform, such as creating custom animations, using templates effectively, and incorporating multimedia elements.
- Troubleshooting and Problem Solving: Develop your ability to troubleshoot common technical issues and find solutions quickly. This includes dealing with formatting problems, incompatible file formats, and technical glitches during a presentation.
Next Steps
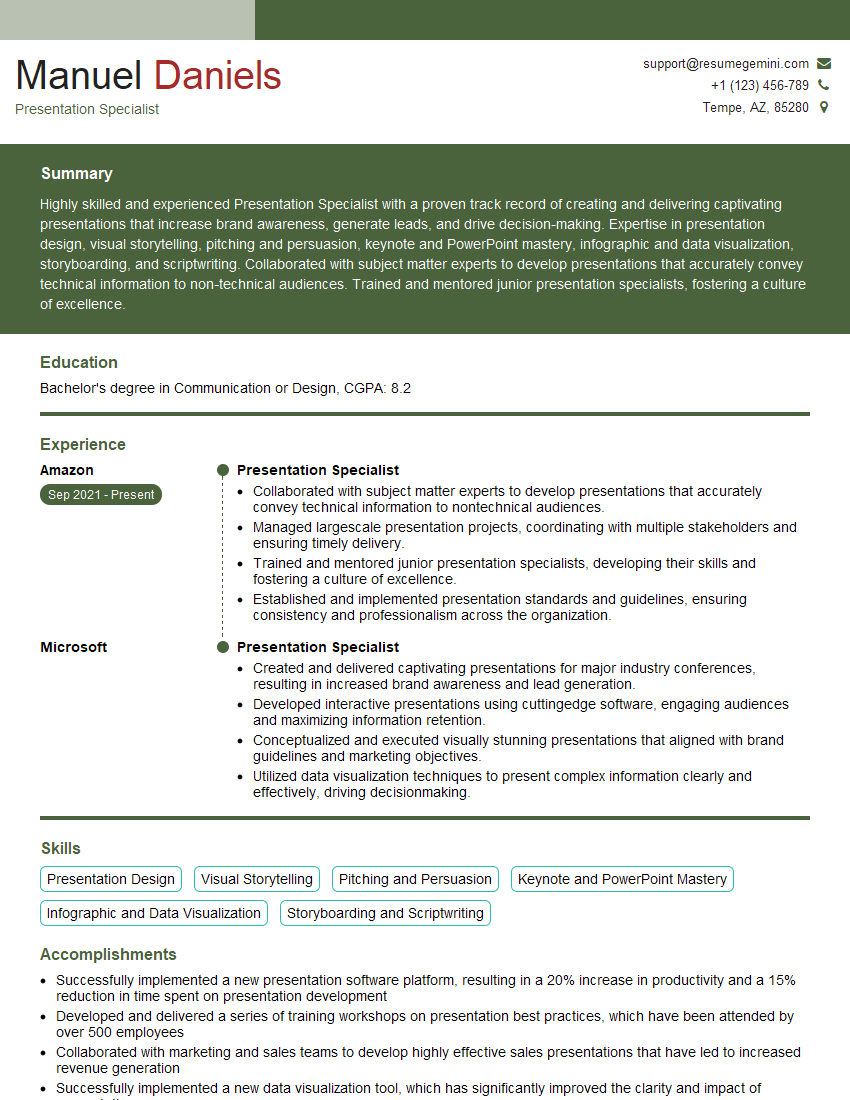
Mastering presentation tools is crucial for career advancement across numerous fields. A strong command of these tools showcases your ability to communicate effectively, visualize complex information, and collaborate efficiently – highly valued skills in today’s job market. To maximize your job prospects, focus on building an ATS-friendly resume that highlights your skills and experience. ResumeGemini is a trusted resource to help you create a compelling and effective resume. We provide examples of resumes tailored specifically to showcase expertise in PowerPoint, Prezi, and Google Slides, to help you get started.
Explore more articles
Users Rating of Our Blogs
Share Your Experience
We value your feedback! Please rate our content and share your thoughts (optional).
What Readers Say About Our Blog
Hi, I’m Jay, we have a few potential clients that are interested in your services, thought you might be a good fit. I’d love to talk about the details, when do you have time to talk?
Best,
Jay
Founder | CEO
