Unlock your full potential by mastering the most common Code Interpretation and Analysis interview questions. This blog offers a deep dive into the critical topics, ensuring you’re not only prepared to answer but to excel. With these insights, you’ll approach your interview with clarity and confidence.
Questions Asked in Code Interpretation and Analysis Interview
Q 1. Explain the difference between interpretation and compilation.
Compilation and interpretation are two fundamental approaches to executing a program written in a high-level language. Think of it like baking a cake: compilation is like having a full recipe (the compiled code) ready to be baked (executed) directly, while interpretation is like following the recipe step-by-step (interpreting each instruction) as you go.
Compilation: In compilation, the entire source code is translated into machine code (the language your computer’s processor understands) before execution. This creates an executable file that can be run directly. Compiled languages generally offer faster execution speeds because the translation is done beforehand. Examples include C, C++, and Go.
Interpretation: In interpretation, the source code is executed line by line, without a prior translation to machine code. An interpreter reads and executes each instruction immediately. This allows for greater flexibility during development and easier debugging, but execution tends to be slower. Examples include Python, JavaScript, and Ruby.
Key Differences Summarized:
- Translation: Compilation translates the entire program at once; interpretation translates and executes line by line.
- Execution Speed: Compiled programs generally run faster; interpreted programs run slower.
- Portability: Compiled programs may be less portable (requiring recompilation for different systems); interpreted programs are generally more portable (running on any system with the interpreter).
- Debugging: Interpreted languages often have easier debugging due to immediate feedback; compiled languages require more advanced debugging tools.
Imagine you’re building a house. Compilation is like prefabricating all the components in a factory and then assembling them on-site. Interpretation is like building the house brick by brick on the site, with each brick representing a line of code.
Q 2. Describe how a debugger works.
A debugger is a powerful tool that allows developers to step through their code line by line, inspect variables, and identify the root cause of errors. Think of it as a detective investigating a crime scene, meticulously examining each step to uncover the culprit (the bug).
Here’s how a debugger typically works:
- Setting Breakpoints: You place breakpoints in your code at specific lines where you want the execution to pause. This allows you to examine the program’s state at that point.
- Stepping Through Code: You can use commands like ‘step over’, ‘step into’, and ‘step out’ to control the execution flow. ‘Step over’ executes the current line and moves to the next. ‘Step into’ enters a function call, allowing you to trace its execution. ‘Step out’ jumps out of the current function.
- Inspecting Variables: The debugger allows you to view the current values of variables, arrays, and other data structures. This helps you understand the program’s state at any point.
- Call Stack Inspection: You can examine the call stack, which shows the sequence of function calls that led to the current point in the execution. This is invaluable for understanding the flow of control and identifying the source of errors.
- Watchpoints: You can set watchpoints on variables, which pause execution when the variable’s value changes. This is useful for tracking down elusive bugs.
Modern debuggers often have graphical user interfaces (GUIs) that provide a user-friendly environment for these operations. They are indispensable for identifying and fixing bugs in software, saving significant development time and effort.
Q 3. How would you identify a memory leak in a given code snippet?
A memory leak occurs when a program allocates memory but fails to release it when it’s no longer needed. This leads to gradual consumption of available memory, eventually resulting in performance degradation or program crashes. Identifying them requires a methodical approach.
Methods to Identify Memory Leaks:
- Memory Profilers: Tools like Valgrind (for C/C++), and heap-profiling tools in languages like Java and Python, track memory allocation and deallocation. These tools visually show memory usage over time, highlighting areas where memory isn’t being released.
- Code Review: Carefully examine code for patterns of dynamic memory allocation (using
malloc/freein C,new/deletein C++, etc.). Look for instances where memory is allocated but not freed in all possible code paths, particularly within loops or error handling sections. For instance, if an exception occurs beforefreeis called, there is a leak. - Memory Debugging Tools: Debuggers often include memory analysis features that detect memory leaks by tracking memory usage during program execution.
- Monitoring System Resources: Observe your system’s memory usage while the program is running. A steadily increasing memory footprint, even after the program’s workload has reduced, strongly indicates a leak.
Example (Conceptual C++):
class MyClass {
public:
    MyClass() { data = new int[1000]; }
    ~MyClass() { delete[] data; }
private:
    int* data;
};

int main() {
    MyClass* obj = new MyClass();
    // ... use obj ...
    // MISSING: delete obj;  <-- Memory leak!
    return 0;
}
In this example, the delete obj; statement is missing, resulting in a memory leak. The memory allocated for obj remains allocated even after main() completes.
Q 4. Explain different types of code complexity and their implications.
Code complexity refers to how difficult it is to understand, modify, or debug a piece of code. High complexity leads to increased development time, more bugs, and higher maintenance costs. Several types exist:
1. Cyclomatic Complexity: Measures the number of linearly independent paths through a piece of code. Higher cyclomatic complexity often indicates a more intricate control flow, making it harder to reason about the code's behavior. It's often used to identify overly complex functions or modules that need refactoring.
2. Cognitive Complexity: Focuses on the mental effort required to understand a piece of code. It considers factors like nested loops, conditional statements, and the number of variables used. High cognitive complexity increases the chances of errors and makes it difficult for developers to grasp the code's logic.
3. Nesting Depth: The level of nested loops, conditional statements, and function calls. Deep nesting makes code harder to follow and increases the potential for errors.
4. Data Structure Complexity: Refers to the intricacy of the data structures used. Complex data structures may be powerful, but they can increase code complexity if not used and managed carefully.
Implications of High Complexity:
- Increased Development Time: More time is needed to write, understand, and test complex code.
- More Bugs: Complex code is more prone to errors, and these errors are often more difficult to find and fix.
- Higher Maintenance Costs: Maintaining and modifying complex code is expensive and time-consuming.
- Reduced Readability: Complex code is difficult to understand, making collaboration and knowledge sharing challenging.
Tools like SonarQube and static code analysis tools can help measure and identify complex code sections, allowing developers to refactor them for better maintainability.
Q 5. How do you approach analyzing a large codebase for potential vulnerabilities?
Analyzing a large codebase for vulnerabilities is a complex task requiring a systematic approach. It's similar to searching for hidden clues in a vast mystery.
My Approach:
- Static Analysis: Employ static analysis tools (like SonarQube, Fortify, etc.) to automatically scan the code for common vulnerabilities like SQL injection, cross-site scripting (XSS), and buffer overflows. These tools analyze the code without actually executing it.
- Dynamic Analysis: Utilize dynamic analysis techniques, such as penetration testing, to simulate real-world attacks. This helps identify vulnerabilities that static analysis might miss.
- Code Review: Conduct thorough code reviews, particularly focusing on areas identified by static and dynamic analysis. Expert eyes can often catch subtle vulnerabilities that automated tools may miss.
- Vulnerability Databases: Consult publicly available vulnerability databases (like the National Vulnerability Database) and vendor security advisories to identify known vulnerabilities affecting the libraries and frameworks used in the codebase.
- Security Frameworks: Adhere to established security frameworks like OWASP (Open Web Application Security Project) to ensure consistent security practices throughout the development lifecycle.
- Prioritization: Prioritize vulnerabilities based on their severity and likelihood of exploitation. Focus on addressing critical vulnerabilities first.
- Documentation: Maintain detailed documentation of identified vulnerabilities, remediation efforts, and residual risks.
By combining automated tools with manual review and a structured approach, you can effectively identify and address potential vulnerabilities within a large codebase. This helps reduce the risk of security breaches and ensures the software's integrity and safety.
Q 6. What are common code smells and how do you address them?
Code smells are indicators of potential problems in the code. They are not necessarily bugs, but they suggest that something might be wrong, or at least could be improved. They're like little warning signs in a house that suggest a bigger potential issue.
Common Code Smells and How to Address Them:
- Long Methods/Functions: A method or function that is excessively long is difficult to understand and maintain. Break it down into smaller, more focused methods.
- Large Classes: Classes that have too many responsibilities are hard to manage. Apply the Single Responsibility Principle (SRP) to break them down into smaller, more focused classes.
- Duplicate Code: Repeating code blocks indicate a potential for refactoring into reusable components. Extract the common parts into a separate method or class.
- Switch Statements: Large switch statements (or nested switch statements) suggest potential use of polymorphism or a strategy pattern for a cleaner design. Refactor to use these design patterns.
- Long Parameter Lists: Functions with too many parameters are hard to manage. Consider creating objects or data structures to bundle related parameters.
- Data Clumps: Groups of variables that are always used together often suggest a new class or data structure is needed to encapsulate them.
- God Classes/Methods: These are classes or methods that control too much of the application's logic, making them difficult to test and maintain. Refactor to distribute responsibilities.
Addressing code smells improves code readability, maintainability, and reduces the risk of introducing future bugs. Code reviews and static analysis tools can help identify many code smells.
Q 7. What are some common debugging techniques for finding segmentation faults?
Segmentation faults, also known as segfaults, occur when a program attempts to access memory it doesn't have permission to access. Debugging these can be tricky, but systematic techniques can help.
Debugging Techniques for Segmentation Faults:
- Debugger (GDB, LLDB): Use a debugger to run the program step by step. When the segfault occurs, the debugger will often pinpoint the exact line of code causing the error. You can then inspect the variables and memory locations to understand what went wrong. Use the backtrace command to see the sequence of function calls.
- Memory Inspection: Check if you are accessing memory beyond the bounds of an array or pointer. Ensure your pointers are properly initialized and that you don't dereference null pointers (pointers that don't point to any valid memory location).
- Address Sanitizer (ASan): This tool can detect many memory-related errors, including out-of-bounds accesses and use-after-free errors. ASan is effective for quickly finding many segmentation fault causes.
- Valgrind (for C/C++): Valgrind is a powerful memory debugging and profiling tool that can detect a wide range of memory errors, including segmentation faults, memory leaks, and use-after-free errors. It's more comprehensive than ASan but slower.
- Compiler Warnings: Enable compiler warnings at a high level (-Wall for GCC/Clang). Many potential segfaults are flagged by the compiler.
- Code Review: Carefully examine code sections where pointers and memory allocation are used. Pay close attention to array indices, pointer arithmetic, and memory deallocation.
The key is methodical examination of the code and utilizing the right debugging tools for a more efficient process. Remember to always check for null pointers, out-of-bounds array accesses, and ensure proper memory management.
Q 8. How would you analyze the performance of a given algorithm?
Analyzing algorithm performance involves understanding how its runtime and memory usage scale with input size. We use a combination of techniques. Firstly, profiling tools like those built into IDEs (Integrated Development Environments) or standalone profilers can pinpoint bottlenecks – specific parts of the code consuming excessive time or memory. These tools often provide detailed reports showing the time spent in each function call. Secondly, benchmarking involves running the algorithm with various input sizes and measuring the execution time. This allows us to observe trends and identify potential performance issues. Finally, theoretical analysis using Big O notation (explained in the next question) provides an estimate of the algorithm's performance characteristics without needing to run it, crucial for anticipating scalability issues before deployment. For example, if profiling reveals a nested loop is the bottleneck, we can investigate if it can be optimized, perhaps by using a more efficient algorithm or data structure. Benchmarking different optimization strategies helps to determine which yields the best performance improvements.
Q 9. Explain Big O notation and its significance in code analysis.
Big O notation describes the upper bound of an algorithm's time or space complexity. It expresses how the runtime or memory usage grows as the input size (n) increases. It focuses on the dominant factors, ignoring constant factors and smaller terms. For instance, an algorithm with a time complexity of O(n) means the runtime grows linearly with the input size. O(n²) indicates a quadratic growth, while O(log n) represents logarithmic growth, which is significantly more efficient for larger inputs. O(1) denotes constant time complexity, meaning the runtime remains the same regardless of input size. The significance lies in comparing algorithms and making informed decisions about which to use for a given task. For example, choosing a O(log n) search algorithm like binary search over a linear O(n) search becomes critically important when dealing with a million data points. The difference in execution time can be enormous.
// Example: Linear search (O(n))
for (int i = 0; i < n; i++) {
  if (array[i] == target) return i;
}
Q 10. Describe how you would approach optimizing a slow piece of code.
Optimizing slow code starts with profiling to identify bottlenecks. Once we pinpoint the slow parts, we explore several optimization strategies. Algorithm optimization involves replacing inefficient algorithms with more efficient ones. For example, replacing a bubble sort with a merge sort. Data structure optimization means choosing appropriate data structures. A hash table might replace a linear search if fast lookups are needed. Code refactoring focuses on improving code structure without changing its functionality, enhancing readability and performance. For example, removing redundant calculations or eliminating unnecessary object creations. Caching stores frequently accessed data in memory for faster retrieval. Finally, parallelization can leverage multi-core processors for concurrent execution of tasks, reducing overall runtime. The approach is iterative; we profile, optimize, and re-profile until satisfactory performance is achieved. For example, I once optimized a database query that was taking hours by rewriting it with better indexing and query optimization techniques, reducing runtime to minutes.
Q 11. What are some common design patterns and how do they affect code readability and maintainability?
Design patterns are reusable solutions to common software design problems. They significantly improve code readability and maintainability by promoting consistency and reducing complexity. Some common patterns include:
- Singleton: Ensures only one instance of a class exists.
- Factory: Creates objects without specifying their concrete classes.
- Observer: Defines a one-to-many dependency between objects.
- Decorator: Dynamically adds responsibilities to an object.
- Strategy: Defines a family of algorithms, encapsulating each one, and making them interchangeable.
These patterns improve readability because they introduce familiar structures making the code easier to understand. They enhance maintainability because changes in one part of the system are less likely to affect other parts. For instance, using the Strategy pattern allows algorithms to be swapped without modifying client code, increasing flexibility and maintainability.
Q 12. How do you determine the time and space complexity of an algorithm?
Determining time and space complexity involves analyzing the algorithm's operations as a function of input size (n). For time complexity, we count the number of basic operations (comparisons, assignments, arithmetic operations) performed. For example, a linear search has O(n) time complexity because it iterates through the input once. Nested loops often lead to higher complexity (e.g., O(n²)). For space complexity, we analyze the amount of memory used by the algorithm as a function of the input size. This includes memory for variables, data structures, and function calls. A recursive algorithm with no tail recursion could potentially use O(n) space due to the call stack. Consider a simple sorting algorithm like insertion sort. Its time complexity is O(n²) in the worst case, as the inner loop might run n times for each element, and its space complexity is typically O(1) because it sorts in-place. Analyzing complexity helps in selecting the most suitable algorithm for a specific problem considering resource limitations.
Q 13. Explain the importance of code documentation and commenting.
Code documentation and commenting are crucial for code maintainability, collaboration, and understanding. Documentation provides a high-level overview of the code, explaining its purpose, functionality, and usage. Well-written documentation acts as a guide for others (and your future self) to understand the code's design and functionality. Comments within the code explain specific parts, algorithms, or complex logic, enhancing readability and making it easier to follow the code flow. Effective documentation and commenting save time and effort during debugging, maintenance, and future development. In a team environment, clear documentation is essential for collaboration, allowing team members to easily understand and modify each other's code. Consider a large project with many developers; lack of documentation leads to significant inefficiencies and potential errors.
Q 14. How would you refactor a poorly written function?
Refactoring a poorly written function involves a systematic approach. First, I would thoroughly understand the function's purpose and functionality. Then, I would break it down into smaller, more manageable units improving clarity. Next, I would rename variables and functions to reflect their purpose accurately. Improving code structure using design patterns might be necessary. For instance, I might extract repeated logic into a separate function or apply a strategy pattern to make the code more flexible. I would introduce meaningful comments to explain complex parts. Finally, I would add comprehensive tests to validate that refactoring has not altered functionality. A poorly written function can make the code difficult to understand and maintain, leading to errors. Refactoring enhances readability, maintainability, and reduces the risk of future bugs. For example, a function with many nested if-else statements might be refactored using a switch statement or polymorphism, significantly improving code clarity.
Q 15. How do you use version control to track changes to code?
Version control systems (VCS) like Git are essential for tracking changes in code. Think of it like a time machine for your project. Each time you save a significant change (or even a small one!), you create a 'snapshot' called a commit. These commits are chronologically ordered, allowing you to revert to older versions if needed, see who made which changes, and collaborate effectively with others.
The process usually involves creating a repository (a central storage for your code), staging changes (selecting which parts you want to save in the next commit), committing (saving the snapshot with a descriptive message), and pushing (uploading your commits to a remote server like GitHub or GitLab for backup and collaboration).
For example, imagine you're building a website. You might have a commit for adding the homepage, another for implementing the navigation bar, and another for fixing a bug in the contact form. If the navigation bar breaks later, you can easily revert to the commit *before* you made the changes to fix it.
git add .
git commit -m "Added homepage"
git push origin main
Career Expert Tips:
- Ace those interviews! Prepare effectively by reviewing the Top 50 Most Common Interview Questions on ResumeGemini.
- Navigate your job search with confidence! Explore a wide range of Career Tips on ResumeGemini. Learn about common challenges and recommendations to overcome them.
- Craft the perfect resume! Master the Art of Resume Writing with ResumeGemini's guide. Showcase your unique qualifications and achievements effectively.
- Don't miss out on holiday savings! Build your dream resume with ResumeGemini's ATS optimized templates.
Q 16. Explain the differences between various sorting algorithms and their efficiencies.
Sorting algorithms are methods for arranging elements in a specific order (e.g., ascending or descending). Different algorithms have varying efficiencies, primarily measured by their time and space complexity.
- Bubble Sort: Simple but inefficient. Repeatedly steps through the list, compares adjacent elements, and swaps them if they are in the wrong order. O(n²) time complexity, making it slow for large datasets.
- Insertion Sort: Builds the final sorted array one item at a time. It is more efficient than bubble sort for small lists. O(n²) time complexity in the worst and average cases, but O(n) in the best case (already sorted array).
- Merge Sort: A divide-and-conquer algorithm that recursively divides the list into smaller sublists until each sublist contains only one element, then repeatedly merges the sublists to produce new sorted sublists until there is only one sorted list remaining. O(n log n) time complexity, making it efficient even for large datasets.
- Quick Sort: Another divide-and-conquer algorithm. Selects a 'pivot' element and partitions the other elements into two sub-arrays, according to whether they are less than or greater than the pivot. The sub-arrays are then recursively sorted. Average time complexity is O(n log n), but it can degrade to O(n²) in the worst case (already sorted or reverse-sorted array).
Choosing the right algorithm depends on the dataset size and specific requirements. For small datasets, Insertion Sort might suffice. For larger datasets, Merge Sort or Quick Sort are generally preferred due to their better average-case performance.
Q 17. Describe the process of unit testing and its importance.
Unit testing involves testing individual components (units) of your code in isolation to ensure they function correctly. Imagine building with LEGOs – you wouldn't build a whole castle without testing each individual brick first to ensure it fits properly and doesn't crack under pressure. Similarly, unit tests verify that individual functions or methods work as expected under various conditions.
This is crucial for several reasons:
- Early Bug Detection: Catching errors early in the development cycle is significantly cheaper and easier than fixing them later.
- Improved Code Design: Writing testable code often leads to better modularity and design.
- Regression Prevention: Running tests after making changes helps prevent accidentally breaking existing functionality.
- Increased Confidence: Knowing your code works as expected gives you more confidence when making modifications or adding new features.
Unit tests are typically automated and can be run frequently as part of a continuous integration/continuous delivery (CI/CD) pipeline.
Q 18. How do you handle exceptions in your code?
Exception handling is a crucial aspect of robust code. Exceptions are events that disrupt the normal flow of your program, such as trying to divide by zero or accessing a file that doesn't exist. Properly handling these prevents your program from crashing and allows you to gracefully handle errors.
In most programming languages, this is done using try-except (or similar) blocks. The code that might raise an exception is placed within the try block, and the code to handle the exception is in the except block.
try:
    result = 10 / 0
except ZeroDivisionError:
    print("Cannot divide by zero!")
You can also have multiple except blocks to handle different types of exceptions and a finally block to execute code regardless of whether an exception occurred (e.g., closing a file).
Q 19. What are the benefits of using static analysis tools?
Static analysis tools automatically examine your code *without* executing it. They analyze the code's structure, syntax, and adherence to coding standards to identify potential bugs, security vulnerabilities, and style issues. Think of them as a grammar and spell checker for your code, but far more powerful.
Benefits include:
- Early Bug Detection: Find potential errors before runtime testing.
- Improved Code Quality: Enforce coding standards and best practices.
- Enhanced Security: Identify potential security vulnerabilities like SQL injection or cross-site scripting.
- Reduced Development Costs: Catching errors early saves time and resources.
- Increased Maintainability: Consistent code style makes it easier for others (and your future self) to understand and maintain.
Popular tools include Lint, SonarQube, and FindBugs.
Q 20. What are the differences between white-box and black-box testing?
White-box and black-box testing are two approaches to software testing that differ in how much the tester knows about the internal workings of the system.
- White-box testing (also called clear box testing or glass box testing): The tester has full knowledge of the system's internal structure, code, and algorithms. Tests are designed to cover specific code paths, branches, and conditions. This approach is useful for identifying logic errors or flaws in the code's implementation.
- Black-box testing: The tester has no knowledge of the internal workings of the system. Tests are designed based on the system's specifications and functionality. This approach is useful for identifying defects in the system's overall behavior and usability, regardless of the implementation details.
Imagine testing a vending machine. White-box testing would involve inspecting the internal mechanisms to understand how it dispenses items, while black-box testing would focus solely on interacting with the machine from the outside (inserting money, selecting items, receiving the product).
Q 21. How do you interpret stack traces and log files for debugging purposes?
Stack traces and log files are invaluable tools for debugging. A stack trace is a record of the function calls that led to an error. It shows the sequence of function calls, making it easy to identify the point of failure. Think of it as a trail of breadcrumbs leading you to the source of the problem.
Log files contain records of events that occurred during program execution. They can provide valuable context and information that's not readily available in the stack trace. They're often used to monitor application health, track user activity, or debug performance issues.
Interpreting these involves:
- Identifying the Error: Look at the exception message in the stack trace and identify the type of error.
- Tracing the Execution Path: Follow the sequence of function calls in the stack trace to pinpoint the origin of the error.
- Analyzing Log Messages: Correlate log messages with the stack trace to gather more context and understand the circumstances that led to the error.
- Using Debugging Tools: Debuggers allow you to step through the code line by line, inspect variables, and identify the root cause of the issue.
By carefully examining these, you can reconstruct the sequence of events that led to the error, helping you pinpoint and fix the bug efficiently.
Q 22. Explain the concept of concurrency and how it impacts code analysis.
Concurrency is the ability of multiple tasks to run seemingly simultaneously. Think of it like a chef preparing multiple dishes at once in a kitchen – each dish represents a task, and the chef's actions are concurrent. In code, this is achieved through techniques like multithreading or asynchronous programming. This significantly impacts code analysis because it introduces complexities that don't exist in sequential programs. Analyzing concurrent code requires understanding the intricate interactions between threads or asynchronous operations. We need to consider potential issues like race conditions and deadlocks, which are far less likely in simpler, sequential programs. Tools and techniques for analyzing concurrent code often involve specialized debuggers, race detectors, and static analysis tools that specifically target concurrency-related bugs.
For example, analyzing a simple counter incremented by multiple threads requires understanding how the increment operation is atomic (indivisible) or not. If it's not atomic, we could have unexpected results due to race conditions (discussed further in the next answer). This makes analysis more challenging and necessitates deeper understanding of the underlying hardware and runtime environment.
Q 23. How would you analyze and fix a race condition?
A race condition occurs when multiple threads or processes access and manipulate shared resources simultaneously, leading to unpredictable and incorrect results. It's like two chefs trying to add the same ingredient to a dish at the same time – one might overwrite the other's action. To analyze and fix a race condition, we systematically follow these steps:
- Identify Shared Resources: Pinpoint the variables or data structures accessed by multiple threads. This often requires careful code inspection and a good understanding of the program's architecture.
- Locate Critical Sections: Identify code sections where the shared resources are accessed. These are the critical sections needing protection.
- Use Synchronization Mechanisms: Implement synchronization primitives like mutexes (mutual exclusion locks), semaphores, or atomic operations to protect the critical sections. Mutexes ensure that only one thread can access the critical section at a time, preventing race conditions. Semaphores provide a more general way to control access to resources.
- Verify Correctness: After implementing synchronization, thoroughly test the code to ensure the race condition is eliminated. Use debugging tools, logging, or specialized race detectors to help pinpoint remaining issues.
Example: Consider two threads incrementing a shared counter:
int counter = 0; //Shared resource
void incrementCounter() {
  counter++; //Potential race condition
}
To fix this, we'd protect the counter++ operation with a mutex:
std::mutex mtx;
int counter = 0;
void incrementCounter() {
  mtx.lock();
  counter++;
  mtx.unlock();
}
Q 24. How do you identify and resolve deadlocks in concurrent programs?
A deadlock occurs when two or more threads are blocked indefinitely, waiting for each other to release the resources that they need. It's like a traffic jam where two cars are blocked, each waiting for the other to move. Identifying and resolving deadlocks involves several techniques:
- Detect Deadlocks: Use debugging tools or specialized deadlock detectors to identify the threads involved and the resources they're holding and waiting for. Sometimes, careful code review and understanding thread interactions can also pinpoint the deadlock. Logging can also help identify suspicious thread states.
- Analyze Resource Allocation Graphs: For more complex situations, construct a resource allocation graph that visualizes the dependencies between threads and resources. Cycles in this graph often represent deadlocks.
- Break the Cycle: Once a deadlock is identified, break the cycle by modifying the order in which resources are requested or released. Consider using timeout mechanisms when acquiring locks – if a thread can't acquire a resource within a given time, it may back off and retry later to avoid indefinite blocking. For example, instead of having two threads needing resource A and B, in order, change the order of one.
- Prevent Deadlocks: Good design practices can prevent deadlocks. Techniques include ordering resource acquisition (always acquiring resources in the same order), avoiding unnecessary resource holding (releasing resources as soon as possible), and using timeout mechanisms.
Example: Two threads, Thread A and Thread B, each hold one lock and require the other to complete an action. Thread A holds lock X and needs lock Y, while Thread B holds lock Y and needs lock X. This leads to a deadlock.
Q 25. Describe different types of software testing and their purposes.
Software testing is crucial for ensuring software quality and reliability. Several types of testing exist, each serving a different purpose:
- Unit Testing: Tests individual components or modules of the software in isolation. It's like checking each individual ingredient before adding it to the dish.
- Integration Testing: Tests the interaction between different modules or components. It's like testing how the different ingredients work together.
- System Testing: Tests the entire system as a whole to ensure it meets requirements. It's like testing the completed dish.
- Acceptance Testing: Verifies that the system meets the customer's requirements and is ready for deployment. It's like getting the customer to taste the dish.
- Regression Testing: Ensures that new code changes don't break existing functionality. This involves retesting previously working features after any code modifications.
- Performance Testing: Assesses the speed, scalability, and stability of the system under various loads. This includes load testing, stress testing, and endurance testing.
- Security Testing: Identifies vulnerabilities and weaknesses in the system's security. This could involve penetration testing or vulnerability scanning.
The choice of testing types depends on the project's complexity, criticality, and available resources. A comprehensive testing strategy often employs a combination of these techniques.
Q 26. What strategies do you use to understand unfamiliar codebases?
Understanding an unfamiliar codebase can feel like navigating a maze, but a systematic approach makes it manageable. My strategy involves:
- Top-Down Approach: Start by understanding the overall architecture and design. Read the project documentation (if available), identify key modules and components, and trace the main execution flow. It's like getting the bird's-eye view of the city before exploring its streets.
- Code Navigation Tools: Utilize IDE features like code navigation, search functionality, and call graphs to efficiently explore the codebase. These tools act as your map and compass in this vast code landscape.
- Code Reviews and Comments: Examine existing code comments and leverage code review tools to glean insights into the code's purpose and functionality. Comments are like signposts guiding you through the code.
- Testing and Experimentation: Run existing test cases to observe the system's behavior and identify critical functionalities. Try small modifications to the code to understand how it impacts the behavior.
- Refactoring (Carefully): As understanding increases, refactor small sections of the code to improve readability and maintainability. This should be done incrementally and cautiously to avoid introducing errors.
It's crucial to be patient and persistent. Gradually gaining familiarity with the codebase is often a more effective approach than trying to understand everything at once.
Q 27. Explain how you'd approach debugging a program with intermittent errors.
Debugging intermittent errors is like hunting a ghost – it's there, but elusive. The key is methodical investigation:
- Reproduce the Error: The first step is to try and consistently reproduce the error. This may require careful manipulation of inputs or specific environmental conditions. Detailed logging of system state around the time of error occurrences is very helpful.
- Logging and Monitoring: Implement detailed logging to track the program's execution, especially around the suspected area of the error. System monitoring tools can also help identify resource usage anomalies or other system-level issues.
- Debugging Tools: Use a debugger to step through the code, examine variable values, and set breakpoints to inspect program state at specific points. Profilers can help pinpoint performance bottlenecks.
- Code Review: Carefully examine the code for potential sources of the error, paying attention to concurrency issues, memory management, and exception handling. A second pair of eyes can often spot issues overlooked by the original author.
- Simplify the System: If the system is complex, try simplifying it to isolate the problem. This could involve removing unnecessary features or creating a minimal reproducible example.
Intermittent errors are often subtle, so meticulous attention to detail and systematic investigation are critical. A combination of logging, debugging, and code review is usually required to effectively solve the issue.
Q 28. How do you balance code clarity with performance optimization?
Balancing code clarity and performance optimization is a delicate act – like balancing flavor and presentation in a culinary masterpiece. Both are essential for long-term success. Here's how to strike a balance:
- Prioritize Clarity First: Write clear, well-structured code that's easy to understand and maintain. Optimize for readability unless you have a demonstrable performance bottleneck.
- Profile Before Optimizing: Use profiling tools to identify performance bottlenecks *before* attempting optimizations. Don't waste time optimizing code sections that aren't significant contributors to the overall performance.
- Targeted Optimization: Once bottlenecks are identified, focus optimization efforts on those specific areas. Use appropriate algorithms and data structures, and consider using code-level techniques like memoization, loop unrolling or vectorization.
- Code Review and Testing: After implementing optimizations, thoroughly review the code to ensure that changes haven't negatively impacted readability or introduced bugs. Regress testing is paramount to avoid introducing unintended consequences.
- Use Comments Sparingly: Add comments to explain complex or non-obvious optimization techniques. Comments that add nothing to a clear and readable codebase are often noise.
Remember, premature optimization is often the root of many problems. Prioritize clarity, and only optimize when absolutely necessary and measurable improvement is needed. Over-optimization can lead to unnecessarily complex and harder-to-maintain code that ultimately outweighs any performance benefits.
Key Topics to Learn for Code Interpretation and Analysis Interview
- Data Structures and Algorithms: Understanding fundamental data structures (arrays, linked lists, trees, graphs) and algorithms (searching, sorting, graph traversal) is crucial for efficiently analyzing code and identifying performance bottlenecks. Practical application: Analyzing the time and space complexity of a given algorithm.
- Code Debugging and Tracing: Mastering debugging techniques, including using debuggers and stepping through code line by line, is essential for identifying errors and understanding code execution flow. Practical application: Locating and fixing bugs in a given code snippet, explaining the execution path.
- Object-Oriented Programming (OOP) Principles: A strong grasp of OOP concepts like encapsulation, inheritance, and polymorphism is vital for interpreting and analyzing object-oriented codebases. Practical application: Identifying the relationships between classes and objects in a given program.
- Software Design Patterns: Familiarity with common design patterns (e.g., Singleton, Factory, Observer) helps in understanding the structure and intent behind complex code. Practical application: Recognizing and explaining the use of design patterns in a given codebase.
- Testing and Verification: Understanding different testing methodologies (unit testing, integration testing) and their application in code analysis is important for assessing code quality and reliability. Practical application: Designing test cases to verify the functionality of a given code segment.
- Code Optimization and Refactoring: Knowing how to improve code performance and readability through optimization and refactoring techniques is a valuable skill. Practical application: Identifying areas for improvement in a given code snippet and suggesting refactoring strategies.
- Concurrency and Parallelism: Understanding how to analyze code involving multiple threads or processes is critical for modern software development. Practical application: Identifying potential race conditions or deadlocks in concurrent code.
Next Steps
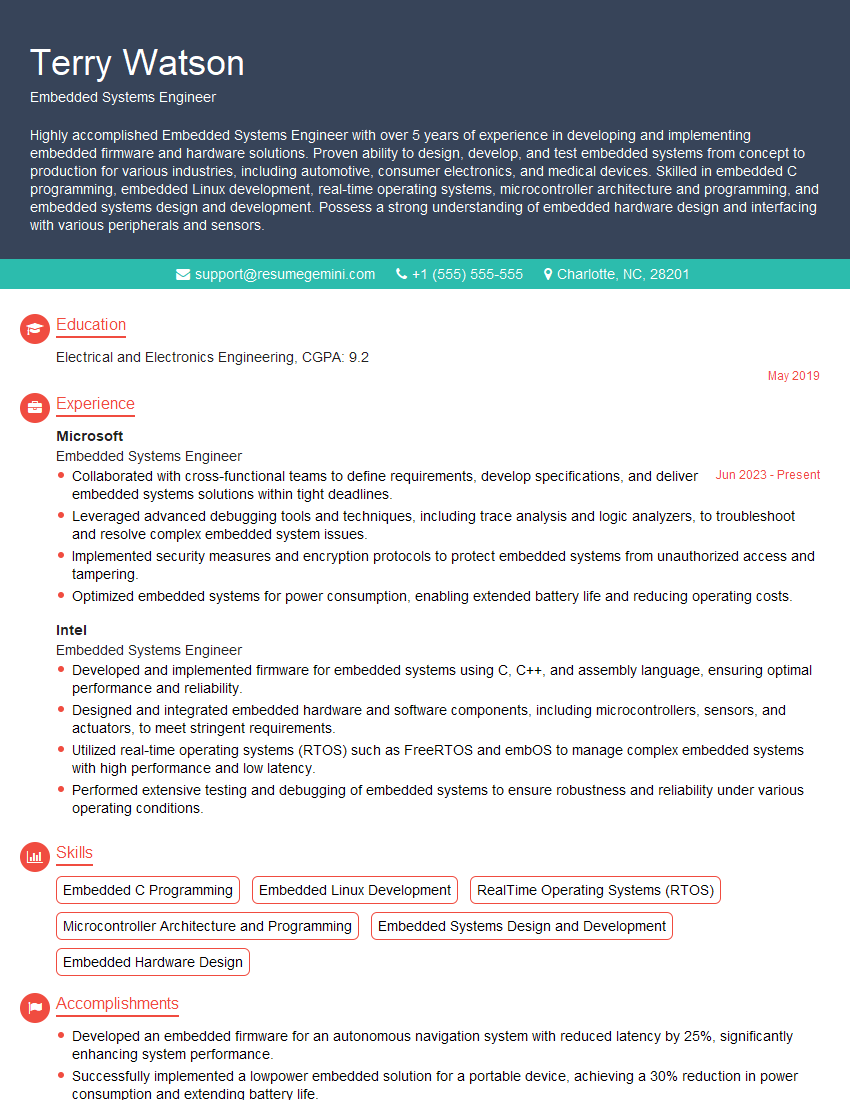
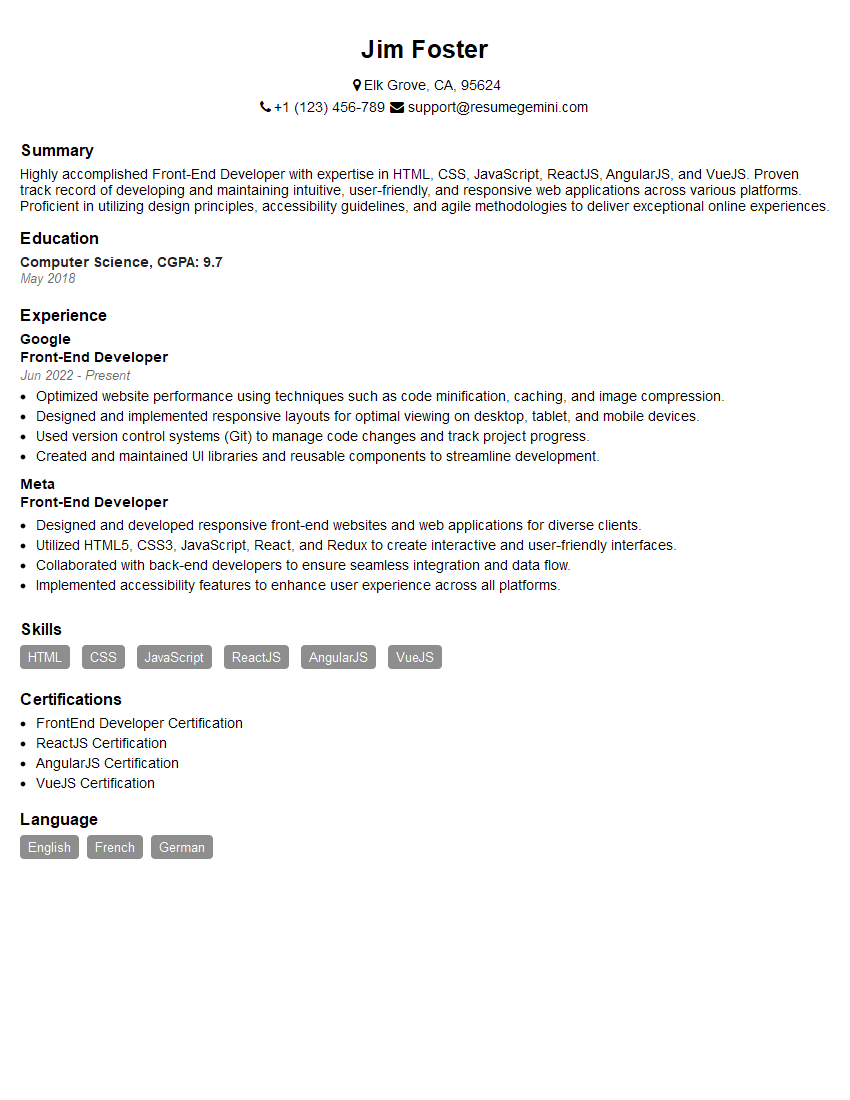
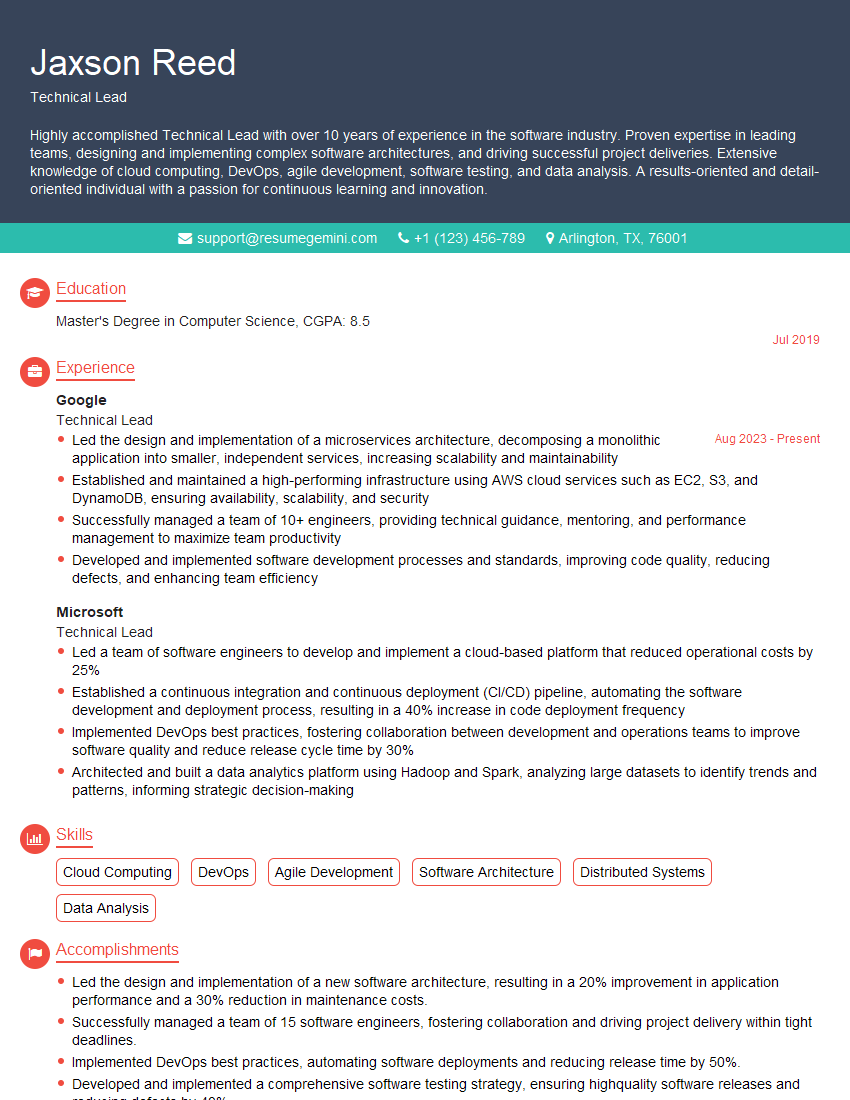
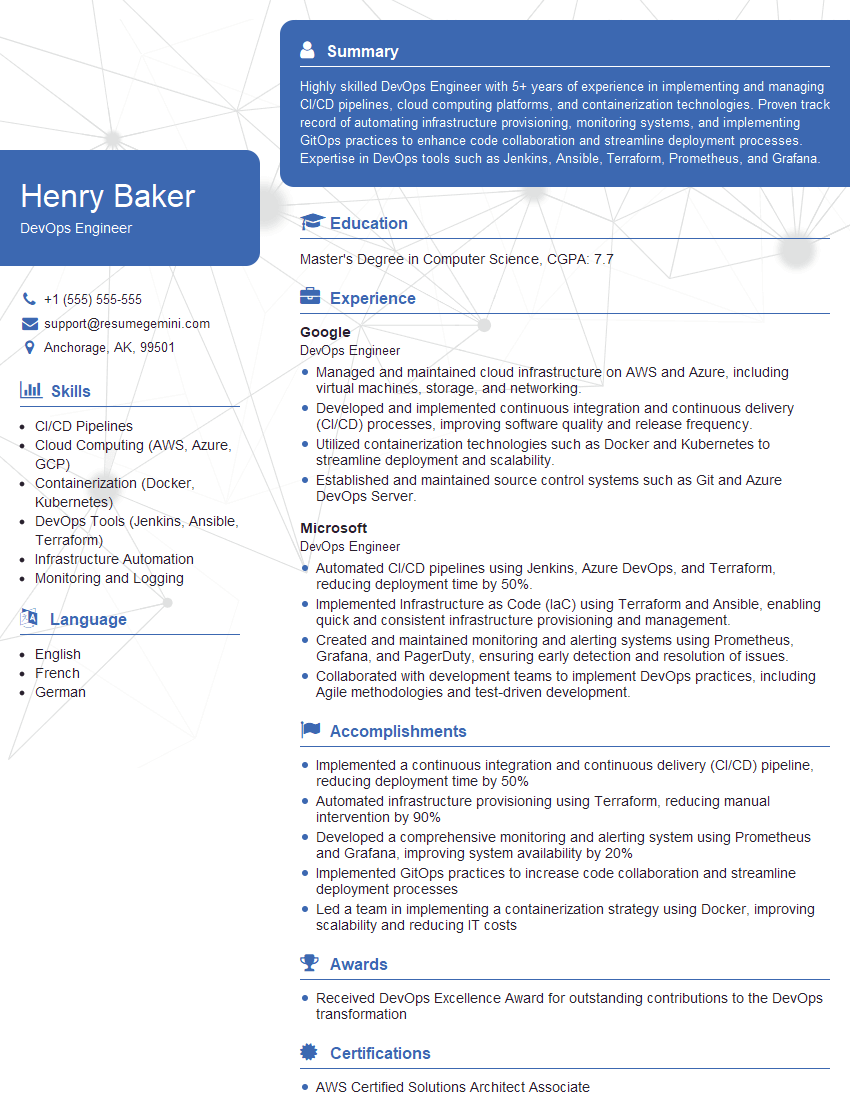
Mastering Code Interpretation and Analysis is vital for career advancement in software development, opening doors to more challenging and rewarding roles. A strong understanding of these concepts allows you to contribute effectively to complex projects and become a valuable asset to any team. To maximize your job prospects, create an ATS-friendly resume that highlights your skills and experience effectively. We highly recommend using ResumeGemini to build a professional and impactful resume. ResumeGemini provides examples of resumes tailored to Code Interpretation and Analysis to help you create a compelling application that stands out from the competition.
Explore more articles
Users Rating of Our Blogs
Share Your Experience
We value your feedback! Please rate our content and share your thoughts (optional).
What Readers Say About Our Blog
Hi, I’m Jay, we have a few potential clients that are interested in your services, thought you might be a good fit. I’d love to talk about the details, when do you have time to talk?
Best,
Jay
Founder | CEO

