The right preparation can turn an interview into an opportunity to showcase your expertise. This guide to Mathematical Reasoning interview questions is your ultimate resource, providing key insights and tips to help you ace your responses and stand out as a top candidate.
Questions Asked in Mathematical Reasoning Interview
Q 1. Explain the difference between inductive and deductive reasoning.
Inductive and deductive reasoning are two fundamental approaches to logical thinking. Inductive reasoning starts with specific observations and moves towards a general conclusion. Think of it like building a house from the ground up; you start with individual bricks (observations) and eventually construct a complete structure (generalization). This conclusion is always probable, not definitively true. Deductive reasoning, on the other hand, begins with a general statement (premise) and examines the possibilities to reach a specific, logical conclusion. It’s like working from a blueprint; you start with the overall design (premise) and deduce the specifics (conclusion). If the premises are true, the conclusion is guaranteed to be true.
- Inductive Reasoning Example: Every swan I have ever seen is white. Therefore, all swans are probably white. (This is a famous example, ultimately false, highlighting the probabilistic nature of inductive reasoning).
- Deductive Reasoning Example: All men are mortal. Socrates is a man. Therefore, Socrates is mortal.
In essence, inductive reasoning is about making generalizations from data, while deductive reasoning is about drawing specific conclusions from general principles. Both are crucial tools in problem-solving and decision-making.
Q 2. Describe Bayes’ Theorem and provide a practical application.
Bayes’ Theorem is a mathematical formula that describes how to update the probability of a hypothesis based on new evidence. It’s a cornerstone of Bayesian statistics, a framework for reasoning under uncertainty. The theorem is expressed as:
P(A|B) = [P(B|A) * P(A)] / P(B)Where:
- P(A|B) is the posterior probability of event A occurring given that event B has occurred.
- P(B|A) is the likelihood of event B occurring given that event A has occurred.
- P(A) is the prior probability of event A.
- P(B) is the prior probability of event B.
Practical Application: Imagine a medical test for a rare disease. Let’s say the disease affects only 1% of the population (prior probability P(A) = 0.01). The test has a 95% accuracy rate (likelihood P(B|A) = 0.95) in correctly identifying those with the disease. However, it also has a 5% false positive rate (meaning it incorrectly says someone has the disease when they don’t). If someone tests positive (event B), Bayes’ Theorem helps calculate the actual probability they have the disease. It’s likely much lower than 95% because of the low prior probability.
Q 3. Solve a linear equation: 3x + 7 = 16
To solve the linear equation 3x + 7 = 16, we need to isolate the variable ‘x’.
- Subtract 7 from both sides: 3x = 9
- Divide both sides by 3: x = 3
Therefore, the solution is x = 3.
Q 4. Calculate the probability of drawing two aces consecutively from a standard deck of cards without replacement.
A standard deck of cards contains 52 cards, with 4 aces. The probability of drawing an ace on the first draw is 4/52. After drawing one ace, there are only 3 aces left and 51 total cards remaining. Therefore, the probability of drawing a second ace consecutively is 3/51.
To find the probability of both events happening consecutively (without replacement), we multiply the individual probabilities:
(4/52) * (3/51) = 12/2652 = 1/221The probability of drawing two aces consecutively without replacement is 1/221.
Q 5. Explain the concept of statistical significance.
Statistical significance refers to the likelihood that an observed result is not due to random chance. In simpler terms, it measures whether the results of a study are ‘real’ or just a fluke. It’s often represented by a p-value. A small p-value (typically below 0.05) suggests that the observed effect is statistically significant, meaning there’s strong evidence to reject the null hypothesis (the idea that there’s no effect). The threshold for significance (e.g., 0.05) is arbitrary and context-dependent.
For example, imagine testing a new drug. A statistically significant result would mean that the observed improvement in patients taking the drug is unlikely to be due to mere chance and likely reflects a true effect of the drug.
Q 6. What is a hypothesis test and how is it conducted?
A hypothesis test is a statistical procedure used to determine whether there is enough evidence to support a claim (hypothesis) about a population. It involves several steps:
- State the hypothesis: Formulate a null hypothesis (H0), representing the status quo, and an alternative hypothesis (H1), which is what you’re trying to prove.
- Set the significance level (alpha): This determines the threshold for rejecting the null hypothesis (typically 0.05).
- Collect data and calculate a test statistic: Gather data relevant to your hypothesis and compute a test statistic (e.g., t-statistic, z-statistic) that summarizes the data.
- Determine the p-value: Find the probability of obtaining the observed results (or more extreme results) if the null hypothesis is true.
- Make a decision: If the p-value is less than the significance level (alpha), reject the null hypothesis; otherwise, fail to reject the null hypothesis. This does not mean you accept the null hypothesis, only that you don’t have enough evidence to reject it.
Example: Testing if a new fertilizer increases crop yield. The null hypothesis (H0) might be that there’s no difference in yield, while the alternative hypothesis (H1) is that the new fertilizer increases yield. You would collect data on crop yields with and without the fertilizer, perform a t-test, and then based on the p-value, decide whether to reject the null hypothesis.
Q 7. Solve the following quadratic equation: x² + 5x + 6 = 0
To solve the quadratic equation x² + 5x + 6 = 0, we can factor the quadratic expression:
The equation can be factored as (x + 2)(x + 3) = 0
Setting each factor to zero, we get two solutions:
- x + 2 = 0 => x = -2
- x + 3 = 0 => x = -3
Therefore, the solutions to the quadratic equation are x = -2 and x = -3.
Q 8. Explain the concept of correlation and causation.
Correlation and causation are two distinct concepts in statistics that often get confused. Correlation refers to a statistical relationship between two or more variables. It simply means that changes in one variable tend to be associated with changes in another. However, correlation does not imply causation. Causation, on the other hand, means that one variable directly influences or causes a change in another.
Think of it this way: if you observe a strong correlation between ice cream sales and crime rates, it doesn’t mean that eating ice cream causes crime. Instead, both are likely influenced by a third, confounding variable – hot weather. Increased temperatures lead to higher ice cream sales and, potentially, more opportunities for crime. This is an example of a spurious correlation.
To establish causation, you need more than just correlation. You’d need to demonstrate a plausible mechanism linking the two variables, control for confounding factors, and ideally, conduct a controlled experiment.
Q 9. What is regression analysis and what are its applications?
Regression analysis is a statistical method used to model the relationship between a dependent variable and one or more independent variables. It helps us understand how changes in the independent variables affect the dependent variable. The goal is to find the best-fitting line or curve that describes this relationship.
There are different types of regression analysis, including:
- Linear Regression: Models a linear relationship between variables.
- Multiple Regression: Models the relationship between a dependent variable and multiple independent variables.
- Polynomial Regression: Models non-linear relationships using polynomial functions.
- Logistic Regression: Used for predicting categorical dependent variables (e.g., success/failure).
Applications of regression analysis are vast and include:
- Predictive Modeling: Forecasting sales, predicting customer churn, estimating stock prices.
- Causal Inference: Assessing the impact of a marketing campaign on sales, determining the effect of education on income.
- Data Analysis: Identifying factors influencing customer satisfaction, understanding the drivers of employee turnover.
For example, a real estate agent might use regression analysis to predict house prices based on size, location, and age. The independent variables would be size, location, and age, and the dependent variable would be the house price.
Q 10. Describe different types of data (nominal, ordinal, interval, ratio).
Data can be categorized into four main types based on the level of measurement:
- Nominal Data: Represents categories without any inherent order. Examples include gender (male/female), colors (red/blue/green), and types of cars (sedan/SUV/truck). Nominal data only allows for counting frequencies.
- Ordinal Data: Represents categories with a meaningful order or ranking, but the differences between categories aren’t necessarily equal. Examples include customer satisfaction ratings (very satisfied/satisfied/neutral/dissatisfied/very dissatisfied), education levels (high school/bachelor’s/master’s/PhD), and rankings in a competition (1st/2nd/3rd).
- Interval Data: Represents data with meaningful order and equal intervals between values, but lacks a true zero point. A classic example is temperature in Celsius or Fahrenheit. The difference between 10°C and 20°C is the same as the difference between 20°C and 30°C, but 0°C doesn’t represent the absence of temperature.
- Ratio Data: Represents data with meaningful order, equal intervals, and a true zero point. Examples include height, weight, age, income, and distance. A value of 0 indicates the absence of the quantity being measured. Ratio data allows for all arithmetic operations.
Understanding the type of data is crucial for choosing the appropriate statistical methods for analysis.
Q 11. How do you handle missing data in a dataset?
Handling missing data is a critical aspect of data analysis. Ignoring it can lead to biased results and inaccurate conclusions. Several methods exist to address missing data, and the best approach often depends on the nature of the data and the amount of missingness.
Common techniques include:
- Deletion: This involves removing data points or variables with missing values. Listwise deletion removes entire rows with any missing data, while pairwise deletion uses available data for each analysis. This is simple but can lead to loss of information and bias if the missing data is not random.
- Imputation: This involves filling in missing values with estimated values. Common methods include:
- Mean/Median/Mode Imputation: Replacing missing values with the mean, median, or mode of the respective variable. Simple, but can distort the distribution.
- Regression Imputation: Predicting missing values using regression models based on other variables. More sophisticated but can be computationally intensive.
- K-Nearest Neighbors Imputation: Imputing missing values based on the values of similar data points.
- Multiple Imputation: Creating multiple plausible imputed datasets to account for uncertainty in the imputation process. Generally preferred for more robust results.
The choice of method depends on factors such as the percentage of missing data, the mechanism causing the missingness (missing completely at random (MCAR), missing at random (MAR), or missing not at random (MNAR)), and the nature of the variables.
Q 12. Explain the central limit theorem.
The Central Limit Theorem (CLT) is a fundamental concept in statistics. It states that the distribution of the sample means of a large number of independent, identically distributed random variables will be approximately normal, regardless of the shape of the original population distribution.
In simpler terms, imagine you’re repeatedly taking samples from a population and calculating the mean of each sample. Even if the original population doesn’t follow a normal distribution (e.g., it’s skewed), the distribution of these sample means will tend towards a normal distribution as the sample size increases. This is true as long as the sample size is sufficiently large (generally considered to be at least 30).
The CLT is crucial because it allows us to make inferences about a population based on sample data, even when we don’t know the population’s distribution. It’s the foundation of many statistical tests and confidence intervals.
Q 13. What is a confidence interval and how is it calculated?
A confidence interval provides a range of values within which we are confident that a population parameter lies. For example, a 95% confidence interval for a population mean suggests that if we were to repeatedly sample from the population and construct confidence intervals in the same manner, 95% of these intervals would contain the true population mean.
The calculation depends on the parameter and the type of data. For a population mean (assuming a known population standard deviation σ), a (1-α)100% confidence interval is calculated as:
Sample Mean ± Zα/2 * (σ / √n)
Where:
Sample Meanis the mean of the sample.Zα/2is the critical value from the standard normal distribution corresponding to the desired confidence level (e.g., for a 95% confidence level, α = 0.05, and Zα/2 ≈ 1.96).σis the population standard deviation.nis the sample size.
If the population standard deviation is unknown, we use the sample standard deviation (s) and the t-distribution instead of the standard normal distribution. The formula becomes:
Sample Mean ± tα/2, n-1 * (s / √n)
Where tα/2, n-1 is the critical value from the t-distribution with n-1 degrees of freedom.
Q 14. Explain the difference between mean, median, and mode.
Mean, median, and mode are measures of central tendency, indicating the center or typical value of a dataset. They differ in how they represent the center:
- Mean: The average value, calculated by summing all values and dividing by the number of values. It is sensitive to outliers (extreme values).
- Median: The middle value when the data is arranged in order. It is less sensitive to outliers than the mean.
- Mode: The value that appears most frequently in the dataset. A dataset can have one mode (unimodal), two modes (bimodal), or more (multimodal). It is not affected by outliers.
Example: Consider the dataset {2, 4, 4, 6, 8, 10, 100}.
- Mean: (2 + 4 + 4 + 6 + 8 + 10 + 100) / 7 ≈ 20.57
- Median: 6
- Mode: 4 and 10 (bimodal)
The mean is heavily influenced by the outlier (100). The median (6) and mode(s) (4 and 10) provide a more representative picture of the typical value in this case. The choice of which measure to use depends on the data distribution and the goal of the analysis.
Q 15. Solve for x: log₂(x) = 3
To solve for x in the equation log₂(x) = 3, we need to understand the definition of a logarithm. The equation logb(x) = y means that by = x. In this case, our base b is 2, and y is 3. Therefore, we can rewrite the equation as 23 = x.
Solving for x, we get x = 2 * 2 * 2 = 8.
Therefore, the solution to the equation log₂(x) = 3 is x = 8.
Career Expert Tips:
- Ace those interviews! Prepare effectively by reviewing the Top 50 Most Common Interview Questions on ResumeGemini.
- Navigate your job search with confidence! Explore a wide range of Career Tips on ResumeGemini. Learn about common challenges and recommendations to overcome them.
- Craft the perfect resume! Master the Art of Resume Writing with ResumeGemini’s guide. Showcase your unique qualifications and achievements effectively.
- Don’t miss out on holiday savings! Build your dream resume with ResumeGemini’s ATS optimized templates.
Q 16. What is a derivative and what does it represent?
The derivative of a function at a point represents the instantaneous rate of change of that function at that specific point. Imagine you’re driving a car; your speed at any given moment is the derivative of your distance traveled with respect to time. It’s the slope of the tangent line to the function’s graph at that point.
More formally, the derivative of a function f(x), denoted as f'(x) or df/dx, is defined as the limit of the difference quotient as the change in x approaches zero: limΔx→0 [(f(x + Δx) - f(x)) / Δx]. This limit, if it exists, gives the instantaneous rate of change.
For example, if f(x) = x², then f'(x) = 2x. This means that at any point x, the instantaneous rate of change of the function is twice the value of x.
Q 17. What is an integral and what does it represent?
An integral is essentially the reverse operation of a derivative. It represents the accumulation of a quantity over an interval. Think of it like calculating the total distance traveled given your speed over a period of time. The integral sums up infinitely small contributions to find the total.
The definite integral of a function f(x) from a to b, denoted as ∫ab f(x) dx, represents the area under the curve of f(x) between x = a and x = b. The indefinite integral adds a constant of integration because the derivative of a constant is zero.
For example, if f(x) = 2x, then the indefinite integral is ∫ 2x dx = x² + C, where C is the constant of integration. The definite integral from 0 to 2 would be ∫02 2x dx = [x²]02 = 4 - 0 = 4, representing the area under the line y = 2x from x = 0 to x = 2.
Q 18. What are the different types of matrices and their operations?
Matrices are rectangular arrays of numbers. Several types exist, each with unique properties and applications:
- Square Matrix: The number of rows equals the number of columns. Example:
[[1, 2], [3, 4]] - Rectangular Matrix: The number of rows is different from the number of columns. Example:
[[1, 2, 3], [4, 5, 6]] - Diagonal Matrix: A square matrix where all off-diagonal elements are zero. Example:
[[1, 0], [0, 2]] - Identity Matrix: A square diagonal matrix with all diagonal elements equal to 1. Example:
[[1, 0], [0, 1]] - Symmetric Matrix: A square matrix that is equal to its transpose (obtained by swapping rows and columns). Example:
[[1, 2], [2, 3]]
Matrix Operations: Include addition, subtraction, multiplication (note that matrix multiplication is not commutative), scalar multiplication (multiplying each element by a constant), and finding the inverse (if it exists) and determinant (for square matrices).
Q 19. Explain the concept of eigenvalues and eigenvectors.
Eigenvalues and eigenvectors are fundamental concepts in linear algebra. Given a square matrix A, an eigenvector v is a non-zero vector such that when multiplied by A, it only scales (stretches or shrinks) in magnitude, but not changes its direction. The scaling factor is the eigenvalue λ.
Mathematically, this is represented as Av = λv. Eigenvalues and eigenvectors provide crucial information about the transformation represented by the matrix. For instance, they indicate the principal directions of stretch or compression of a linear transformation.
Imagine a transformation that stretches space along certain axes. Those axes represent the eigenvectors, and the stretching factors are the eigenvalues. They have wide applications in various fields, including physics (vibration analysis), computer graphics (image compression), and machine learning (principal component analysis).
Q 20. How do you use mathematical models to solve real-world problems?
Mathematical models are used extensively to solve real-world problems by abstracting a system’s key features into mathematical equations or structures. This allows us to analyze, predict, and optimize the system’s behavior.
Process:
- Problem Definition: Clearly identify the problem and its objectives.
- Model Development: Construct a mathematical representation of the system, using equations, differential equations, or other mathematical tools.
- Parameter Estimation: Determine the values of the model’s parameters from available data.
- Model Analysis: Use mathematical techniques (e.g., solving equations, simulations) to analyze the model and make predictions.
- Model Validation: Compare model predictions to real-world observations to assess its accuracy and reliability.
- Model Application: Use the model to inform decision-making and solve the real-world problem.
Examples: Predicting the spread of infectious diseases (epidemiological models), optimizing supply chains (linear programming), forecasting financial markets (time series analysis), designing airplanes (fluid dynamics).
Q 21. What programming languages or tools are you proficient in for mathematical computations?
I am proficient in several programming languages and tools for mathematical computations, including:
- Python with libraries like NumPy, SciPy, and Matplotlib for numerical computations, scientific computing, and data visualization.
- MATLAB, a dedicated platform for numerical computation and visualization.
- R, specializing in statistical computing and data analysis.
- C++, for applications requiring high performance and efficiency.
My choice of language depends on the specific problem and its requirements. For example, Python’s ease of use and extensive libraries make it ideal for prototyping and data analysis, while C++ offers better performance for large-scale computations.
Q 22. Describe your experience with statistical software (e.g., R, SAS, SPSS).
My experience with statistical software is extensive. I’m highly proficient in R, having used it for a wide range of tasks from data cleaning and manipulation to complex statistical modeling and visualization. I’ve leveraged R’s powerful packages like ggplot2 for creating publication-quality graphs and dplyr for efficient data wrangling. I’m also familiar with SAS and SPSS, particularly their strengths in handling large datasets and their robust procedures for advanced statistical analysis. For instance, I utilized SAS for a large-scale epidemiological study, leveraging its PROC REG procedure for regression analysis and its capabilities for handling missing data effectively. In comparison, I found SPSS’s user interface more intuitive for certain tasks, particularly in creating descriptive statistics and conducting basic hypothesis testing. My experience spans various statistical methods including regression analysis, hypothesis testing, ANOVA, time series analysis, and machine learning algorithms.
Q 23. Explain a time you had to solve a complex mathematical problem. What was your approach?
One challenging problem involved optimizing a complex logistics network. The goal was to minimize transportation costs while maintaining delivery deadlines. The network comprised numerous warehouses, distribution centers, and delivery points, each with varying capacities and constraints. My approach involved a multi-step process. First, I formulated the problem as a mixed-integer linear programming (MILP) problem. This involved defining decision variables (e.g., quantity of goods shipped along each route), objective function (minimizing total cost), and constraints (e.g., capacity limits, delivery time windows). Then, I used a solver (like CPLEX or Gurobi) to find the optimal solution. However, due to the problem’s size and complexity, finding the absolute optimal solution within a reasonable timeframe was computationally expensive. Therefore, I employed heuristic algorithms to find near-optimal solutions efficiently. I compared results from different heuristics, evaluating their trade-offs between solution quality and computational time. Finally, I conducted sensitivity analysis to understand the impact of changes in parameters (e.g., fuel prices, delivery deadlines) on the optimal solution. This provided crucial insights for robust decision-making.
Q 24. How do you approach a problem when you don’t know the solution immediately?
When confronted with an unfamiliar problem, I employ a structured approach. I start by clearly defining the problem, breaking it down into smaller, manageable parts. Then, I gather information—researching related concepts, consulting relevant literature, or seeking advice from colleagues. I try to identify patterns or analogies to similar problems I’ve solved before. If a direct solution isn’t apparent, I experiment with different approaches—testing hypotheses, trying various solution strategies, and iteratively refining my approach based on results. Visualization techniques, like drawing diagrams or creating flowcharts, can also be helpful in clarifying the problem and identifying potential solutions. I’m persistent and embrace the learning process, understanding that tackling challenging problems often involves trial and error.
Q 25. Walk me through your understanding of algorithm efficiency (e.g., Big O notation).
Algorithm efficiency is a crucial aspect of algorithm design. Big O notation provides a way to describe the scalability of an algorithm as input size increases. It focuses on the dominant operations as the input size grows very large, ignoring constant factors. For example, an algorithm with O(n) time complexity means the execution time grows linearly with the input size (n). An O(n²) algorithm has quadratic growth, while O(log n) signifies logarithmic growth – very efficient for large datasets. O(1) represents constant time complexity, regardless of input size. Understanding Big O allows us to compare algorithms and choose the most efficient one for a given task. Consider sorting algorithms: Bubble sort is O(n²), while merge sort is O(n log n). For small datasets, the difference might be negligible, but for large datasets, merge sort’s efficiency becomes dramatically superior. The choice of algorithm is guided by the scale of the problem and the acceptable performance trade-offs.
Q 26. Describe a situation where you had to explain a complex mathematical concept to someone with limited mathematical background.
I once had to explain the concept of statistical significance to a team of marketing professionals with limited statistical background. Instead of using jargon like p-values, I used a relatable analogy: imagine flipping a coin 10 times. Getting 7 heads isn’t necessarily unusual. However, getting 99 heads out of 100 flips is highly unlikely and suggests the coin might be biased. Statistical significance works similarly: it measures the likelihood of observing a certain result (e.g., a difference between two groups) by chance alone. A low p-value indicates the observed result is unlikely due to chance, suggesting a real effect. I then connected this to their marketing campaigns, explaining how statistically significant results from A/B testing could inform decisions about ad copy or website design.
Q 27. Explain the concept of set theory and its applications.
Set theory is a fundamental branch of mathematics dealing with collections of objects called sets. A set can contain any type of object, and the order of elements doesn’t matter. Key concepts include: union (combining elements from two sets), intersection (elements common to both sets), and complement (elements not in a given set). Set operations are often represented using Venn diagrams. Set theory has widespread applications. In computer science, sets are used in data structures, databases, and algorithms. In logic, sets form the foundation for propositional and predicate calculus. In probability, events are modeled as sets, enabling the calculation of probabilities using set operations. For instance, in database management, SQL queries often involve set operations like JOIN (similar to intersection) and UNION to combine or filter data from multiple tables.
Q 28. What are your strengths and weaknesses in mathematical reasoning?
My strengths lie in my ability to translate complex mathematical problems into solvable models. I’m adept at abstract thinking, pattern recognition, and problem decomposition. I’m also highly proficient in various mathematical software and possess strong communication skills – essential for conveying technical information effectively. A weakness I’m actively working on is my tendency to get bogged down in the details of a problem, sometimes overlooking the bigger picture. I’m addressing this by practicing time management techniques and prioritizing tasks more effectively. I also proactively seek feedback to ensure I’m focusing my efforts on the most impactful aspects of a project.
Key Topics to Learn for Mathematical Reasoning Interview
- Logical Reasoning: Understanding and applying principles of logic, including deductive, inductive, and abductive reasoning. Practical application: Analyzing data to draw valid conclusions, identifying flaws in arguments.
- Problem-Solving Strategies: Mastering techniques like breaking down complex problems, identifying patterns, working backwards, and using trial and error. Practical application: Developing algorithms, designing efficient solutions to real-world challenges.
- Probability and Statistics: Understanding probability distributions, statistical significance, and hypothesis testing. Practical application: Data analysis, risk assessment, making informed decisions based on data.
- Set Theory and Combinatorics: Working with sets, Venn diagrams, permutations, and combinations. Practical application: Resource allocation, optimization problems, algorithm design.
- Algebraic Reasoning: Proficiency in manipulating equations, inequalities, and functions. Practical application: Modeling real-world scenarios, solving optimization problems.
- Number Theory Fundamentals: Understanding divisibility, prime numbers, modular arithmetic. Practical application: Cryptography, algorithm efficiency analysis.
- Graph Theory Basics (if applicable): Understanding graphs, trees, and their applications. Practical application: Network analysis, optimization problems.
Next Steps
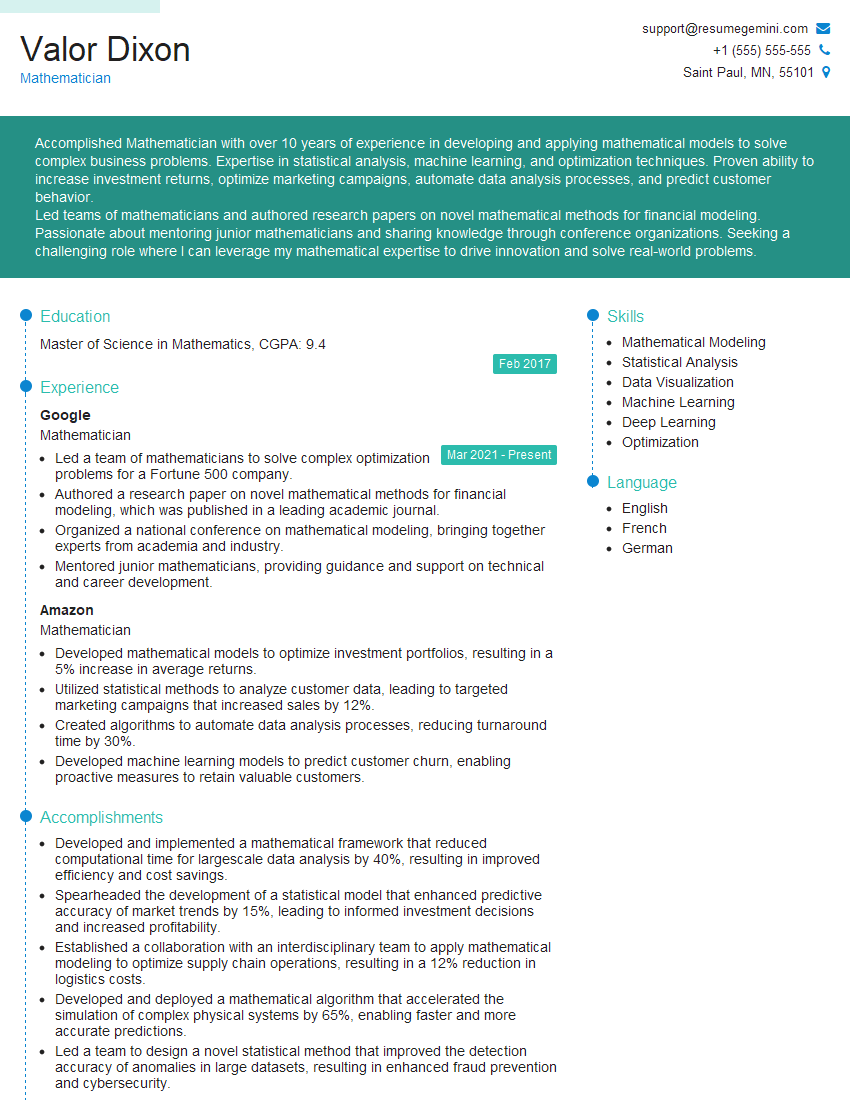
Mastering mathematical reasoning is crucial for career advancement in numerous fields, opening doors to exciting opportunities and higher earning potential. A strong foundation in these skills demonstrates critical thinking and problem-solving abilities highly valued by employers. To maximize your job prospects, ensure your resume is ATS-friendly – easily parsed by Applicant Tracking Systems. We highly recommend using ResumeGemini to craft a professional and impactful resume tailored to highlight your mathematical reasoning skills. Examples of resumes specifically designed for Mathematical Reasoning roles are available to help you get started.
Explore more articles
Users Rating of Our Blogs
Share Your Experience
We value your feedback! Please rate our content and share your thoughts (optional).
What Readers Say About Our Blog
Hi, I’m Jay, we have a few potential clients that are interested in your services, thought you might be a good fit. I’d love to talk about the details, when do you have time to talk?
Best,
Jay
Founder | CEO


