The right preparation can turn an interview into an opportunity to showcase your expertise. This guide to MS Office Suite and Shop Floor Software Proficiency interview questions is your ultimate resource, providing key insights and tips to help you ace your responses and stand out as a top candidate.
Questions Asked in MS Office Suite and Shop Floor Software Proficiency Interview
Q 1. Describe your experience with different ERP systems used in a shop floor environment.
My experience with ERP systems in shop floor environments spans several years and multiple systems. I’ve worked extensively with SAP, Oracle NetSuite, and Infor M3. Each system presents unique challenges and opportunities. For example, SAP is known for its robust capabilities but can require significant customization for specific shop floor needs. Oracle NetSuite, on the other hand, often offers a more streamlined implementation, particularly for smaller-to-medium sized businesses. Infor M3 is specifically designed for discrete manufacturing and excels at managing complex production processes. In each case, my role involved configuring the system to align with the specific manufacturing processes, data needs, and reporting requirements of the organization. This included defining production routings, managing bill of materials, integrating with shop floor data collection systems, and setting up real-time production monitoring dashboards.
A particularly memorable project involved implementing SAP in a large automotive parts manufacturer. The challenge was integrating the system with their existing legacy systems while ensuring minimal disruption to ongoing production. We tackled this by phasing the implementation and employing extensive testing procedures. The successful implementation resulted in significant improvements in inventory management, production planning, and overall operational efficiency.
Q 2. How proficient are you with Microsoft Excel’s advanced features like pivot tables, macros, and VBA?
I’m highly proficient in Microsoft Excel’s advanced features. My skills extend beyond basic spreadsheet creation to encompass sophisticated data manipulation and analysis. I regularly leverage pivot tables to summarize large datasets, quickly identifying trends and anomalies. For instance, I used pivot tables to analyze production data across different shifts, highlighting variations in output and identifying potential bottlenecks. I also utilize macros extensively to automate repetitive tasks, saving considerable time and improving accuracy. For example, I developed a macro to automatically generate weekly production reports, pulling data directly from our shop floor system and formatting it for executive review.
My VBA skills allow me to create custom solutions tailored to specific needs. I’ve developed VBA applications for data validation, report generation, and even custom user interfaces to streamline data entry and analysis within Excel. Imagine a scenario where we needed to calculate complex material costs based on various factors – a VBA script can automate this process seamlessly, eliminating manual calculations and reducing error rates.
'Example VBA code snippet for calculating material costs Function CalculateMaterialCost(quantity As Double, unitCost As Double, overhead As Double) As Double CalculateMaterialCost = quantity * unitCost * (1 + overhead) End Function Q 3. Explain your understanding of MES (Manufacturing Execution Systems) and their integration with ERP systems.
MES, or Manufacturing Execution Systems, act as the nervous system of the factory floor. They provide real-time visibility into production operations, linking shop floor activities to the overall ERP system. Think of the ERP system as the brain, planning and strategizing, while the MES is the nervous system, executing the plans and providing feedback. The integration between an MES and an ERP system is crucial for effective manufacturing management. The MES collects data directly from the shop floor – machine data, labor hours, material usage – and feeds this information back into the ERP system, providing real-time updates on production progress, material consumption, and potential issues.
This integration is typically achieved through APIs or data exchange formats like XML. For example, an MES might send real-time production updates (e.g., completed units, machine downtime) to the ERP system, which then automatically updates inventory levels and production schedules. This close loop provides accurate, up-to-the-minute information, improving decision-making and operational efficiency. Without this integration, you’d have a significant delay in getting crucial shop floor data into your enterprise planning, leading to inaccuracies and inefficiencies.
Q 4. How would you troubleshoot a data discrepancy between the shop floor system and the ERP system?
Troubleshooting data discrepancies between the shop floor system and the ERP system requires a systematic approach. My first step would be to identify the nature and scope of the discrepancy. What data points are mismatched? How significant is the difference? Once the problem is defined, I’d then proceed through a series of steps.
- Data Validation: Verify the accuracy of the data in both systems. Check for data entry errors, corrupted files, or inconsistencies in data formats.
- Integration Point Analysis: Examine the interface between the two systems. Are there any errors in the data transfer process? Are there delays or missing data packets?
- Data Reconciliation: Compare the transaction logs from both systems to pinpoint the exact point of divergence.
- System Logs: Review the system logs of both the shop floor system and the ERP system for any error messages or warnings that might indicate the source of the problem.
- User Interviews: In some cases, the discrepancy might be due to human error. Speaking to operators and other relevant personnel can uncover any procedural issues.
For instance, if a discrepancy in finished goods inventory is found, I might check the shop floor system for un-reported production batches, verify material usage against bill of materials in the ERP system, and check for any discrepancies in inventory transfers.
Q 5. What experience do you have with creating and managing reports using data from shop floor software?
I have extensive experience creating and managing reports using data from shop floor software. My approach always starts with understanding the reporting requirements – who needs the information, what decisions will be made based on the report, and what key performance indicators (KPIs) need to be tracked.
I’ve used a variety of tools for report generation, including Excel, SQL reporting services, and specialized reporting modules within ERP and MES systems. For instance, I’ve developed dashboards to visualize key production metrics such as Overall Equipment Effectiveness (OEE), Mean Time Between Failures (MTBF), and production throughput. These dashboards provide real-time insights into factory performance, helping managers identify areas for improvement. I often use data visualization techniques, such as charts and graphs, to present the data in a clear and concise manner, making it easier to understand and interpret.
In one project, I developed a custom report that tracked material usage and waste across different production lines. This report revealed significant variations in material consumption, which led to the identification and elimination of waste, resulting in substantial cost savings.
Q 6. Describe your experience using Microsoft Access for database management in a manufacturing setting.
My experience with Microsoft Access in a manufacturing setting primarily focuses on database design and management. Access provides a user-friendly environment for creating and managing relatively smaller databases, particularly useful for specific departmental or project needs. I’ve used Access to create databases for tracking quality control data, managing maintenance schedules for equipment, and storing product specifications. This often involves creating tables with appropriate data types, establishing relationships between tables, and developing queries to retrieve and analyze data.
A key aspect of my work with Access has been ensuring data integrity. This includes implementing data validation rules, creating indexes to improve query performance, and designing forms for user-friendly data entry. For instance, I created an Access database to track quality control inspections, with built-in validation rules ensuring that data entered is consistent and accurate. This helped significantly reduce data entry errors and improve the reliability of our quality control reporting.
Q 7. How familiar are you with different shop floor data collection methods (e.g., barcode scanning, RFID)?
I’m familiar with various shop floor data collection methods, each with its own advantages and disadvantages. Barcode scanning remains a widely used and cost-effective method for tracking individual items or work-in-progress. It’s relatively simple to implement and provides accurate data for tracking inventory and production progress.
RFID (Radio-Frequency Identification) offers a more advanced solution, allowing for real-time tracking of multiple items simultaneously without the need for line-of-sight. This is particularly useful in scenarios with high-volume production or where tracking items through multiple stages of the manufacturing process is critical. For example, RFID tags could be attached to pallets of raw materials, allowing for automated tracking of their movement through the warehouse and onto the production floor.
Other methods include manual data entry (which is prone to errors and inefficiencies), and more sophisticated methods incorporating sensors and machine-to-machine communication, which are especially important in smart factory environments. The choice of method depends on factors like budget, production volume, required accuracy, and the level of automation in the factory.
Q 8. Explain your understanding of key performance indicators (KPIs) used in manufacturing and how you track them.
Key Performance Indicators (KPIs) in manufacturing are quantifiable metrics used to track progress toward achieving organizational goals. They provide a clear picture of operational efficiency and help identify areas for improvement. Common KPIs include:
- Overall Equipment Effectiveness (OEE): Measures the percentage of planned production time that is actually used effectively. I track this by integrating data from shop floor software with Excel, using formulas to calculate OEE based on availability, performance, and quality rate.
- Throughput: The rate at which a system produces outputs. I monitor throughput using shop floor software’s real-time dashboards and create reports in Excel to analyze trends and identify bottlenecks. For example, I might chart throughput per day for the past month to spot any unexpected dips.
- Defect Rate: The percentage of defective units produced. This is tracked through quality control checks within the shop floor system and analyzed in Excel using pivot tables to identify root causes of defects by machine, operator, or material.
- Lead Time: The time it takes to complete a product from order to delivery. I use shop floor software to monitor lead times for each order and identify areas for improvement, such as streamlining processes or optimizing resource allocation. This data is then presented in clear charts and graphs using Excel or Power BI.
- Inventory Turnover: How quickly inventory is sold or used. I would integrate data from the shop floor system with inventory management software and use Excel to calculate inventory turnover ratios, allowing for timely identification of slow-moving items and potential stock-outs.
Tracking these KPIs involves a combination of real-time monitoring through the shop floor management system and offline analysis in tools like Excel or Power BI. Regular reporting and data visualization are crucial for effective monitoring and improvement. For instance, I’d create weekly or monthly dashboards showing key KPI trends, enabling proactive management decisions.
Q 9. How would you use Microsoft PowerPoint to present shop floor data to management?
To present shop floor data effectively to management using PowerPoint, I focus on clear, concise visuals and a narrative that highlights key insights. I’d start with a high-level summary slide showcasing the most critical KPIs using charts and graphs generated from Excel. Then, I’d delve into more detailed data, using:
- Charts and Graphs: Bar charts to compare performance across different production lines, pie charts to show the breakdown of defect causes, and line graphs to track KPI trends over time.
- Data Tables: Clean, well-formatted tables to present specific data points. I ensure these are visually appealing and easily digestible.
- Visual Aids: Images of the shop floor or equipment can help contextualize the data. Perhaps a before-and-after picture showing an improvement initiative’s success.
- Animations and Transitions: Used sparingly to highlight key data points and maintain audience engagement, not to overwhelm the presentation.
My PowerPoint presentation would tell a story, starting with the overall performance summary and then progressing to more detailed analyses of specific areas, highlighting problems and successes, and suggesting solutions or next steps. The goal is to provide actionable insights, not just data dumps.
Q 10. Describe your experience with data analysis and reporting using Microsoft Excel or other BI tools.
My experience with data analysis and reporting using Microsoft Excel and other BI tools is extensive. I’m proficient in using Excel’s advanced features such as:
- Pivot Tables and Pivot Charts: To summarize and analyze large datasets, enabling quick identification of trends and patterns in production data.
- Formulas and Functions: Including VLOOKUP, INDEX-MATCH, SUMIFS, and COUNTIFS, to extract, manipulate, and analyze data from various sources, including shop floor software.
- Data Validation: To ensure data accuracy and consistency within spreadsheets.
- Conditional Formatting: To highlight important data points or trends visually.
- Charts and Graphs: To create effective visual representations of data, including line graphs, bar charts, scatter plots, and more.
Beyond Excel, I have experience using Power BI to create interactive dashboards and reports which allow for more sophisticated data exploration and visualization. I can connect to multiple data sources, including shop floor databases, and create dynamic reports that can be shared across the organization. For example, I’ve built dashboards that track real-time OEE and provide alerts when key metrics fall below target values.
Q 11. How would you use Microsoft Word to create standardized shop floor documents?
Creating standardized shop floor documents in Microsoft Word involves leveraging its features for efficiency and consistency. I use:
- Templates: Creating pre-formatted templates for frequently used documents such as work instructions, quality control reports, and maintenance logs. This ensures consistency in formatting and content. For example, I’d create a template for work instructions that includes sections for safety precautions, step-by-step procedures, diagrams, and sign-off areas.
- Styles and Formatting: Consistent use of headings, styles, and formatting ensures professional-looking documents that are easy to read and understand.
- Tables and Lists: To organize information clearly and effectively. For example, a table might list all the tools and materials required for a specific task.
- Mail Merge: For generating personalized documents, such as individual employee training certificates or equipment maintenance schedules.
- Version Control: Using Word’s track changes and comments features to manage multiple revisions and ensure clarity of any changes.
By using templates and consistent formatting, I ensure that all shop floor documents adhere to company standards and are readily understood by all personnel. This reduces ambiguity and improves overall efficiency. I also utilize features like macros to automate repetitive tasks if necessary.
Q 12. What is your experience with using shop floor software to manage production schedules?
My experience with shop floor software to manage production schedules involves using various systems to plan, schedule, and monitor production activities. I’m familiar with both ERP (Enterprise Resource Planning) and MES (Manufacturing Execution System) systems. My experience includes:
- Production Scheduling: Using the software to create and manage production schedules, taking into account factors such as material availability, machine capacity, and labor resources.
- Material Requirements Planning (MRP): Utilizing the system’s MRP capabilities to plan and procure raw materials necessary to meet production demands. This prevents production delays caused by missing components.
- Capacity Planning: Assessing the manufacturing capacity and identifying potential bottlenecks to optimize production scheduling and resource allocation.
- Real-time Monitoring: Tracking production progress, identifying delays, and taking corrective actions as needed. This often involves using real-time dashboards provided by the software.
- Reporting and Analysis: Generating reports on production performance, material usage, and other key metrics to identify areas for improvement.
I have experience with various shop floor software packages, and I’m adept at adapting to new systems. My proficiency lies not just in using the software but in leveraging its capabilities to optimize production and improve efficiency. I’m accustomed to configuring parameters and optimizing settings to align software functions with specific production needs.
Q 13. Explain your understanding of different production scheduling methodologies (e.g., Kanban, MRP).
Different production scheduling methodologies offer diverse approaches to managing production flow. I am familiar with several including:
- Material Requirements Planning (MRP): A demand-pull system that plans production based on sales forecasts and inventory levels. It calculates the precise materials and quantities needed at specific times to meet demand. It’s helpful for managing complex production processes with many components and long lead times.
- Kanban: A lean manufacturing system that uses visual signals (e.g., Kanban cards) to manage workflow. It focuses on just-in-time production, reducing inventory and minimizing waste. It is very effective in environments that require flexibility and quick response to changes in demand.
- Just-in-Time (JIT): An inventory management system that aims to minimize inventory by receiving materials only as they are needed for production. This requires highly efficient coordination between suppliers and production.
- Drum-Buffer-Rope (DBR): A scheduling method designed to manage constraints and improve flow. The “drum” is the bottleneck, the “buffer” is the inventory kept before the bottleneck, and the “rope” is the signal that releases work to the bottleneck. It helps to prevent bottlenecks from halting the entire production process.
The choice of scheduling methodology depends heavily on factors such as production complexity, inventory levels, demand variability, and the overall business strategy. I can assess these factors and recommend the most suitable methodology for a given production environment. Experience allows me to tailor these methodologies and often incorporate elements of multiple systems to develop a customized approach.
Q 14. How familiar are you with different types of shop floor control systems (e.g., SCADA, PLC)?
My familiarity with shop floor control systems includes both SCADA and PLC systems. I understand their roles in automation and data acquisition.
- Supervisory Control and Data Acquisition (SCADA): A system for monitoring and controlling industrial processes, often using a central computer to monitor data from multiple sources. I understand how SCADA systems are used to monitor real-time data from sensors and PLCs, providing a centralized view of the shop floor. For example, I can use SCADA systems to monitor machine status, production rates, and other critical parameters. This data feeds into our KPIs and reporting systems.
- Programmable Logic Controllers (PLCs): These are specialized computers used for controlling automated processes in industrial settings. I have a working understanding of PLC programming and how it integrates with SCADA systems to automate tasks, such as controlling individual machines or material handling systems. This is valuable for integrating shop floor automation with other production monitoring tools.
While I am not a PLC programmer, my understanding of how PLCs and SCADA systems interact is critical for interpreting data and using it effectively for reporting and analysis. This allows me to efficiently work with automation engineers and technicians to integrate and optimize data flow from these systems.
Q 15. How would you identify and address bottlenecks in a manufacturing process using shop floor data?
Identifying and addressing bottlenecks in a manufacturing process starts with analyzing shop floor data. Think of it like unclogging a drain – you need to pinpoint where the blockage is before you can fix it. We can use shop floor data, often collected through a Manufacturing Execution System (MES), to identify areas where production is slowing down. This data might include machine downtime, cycle times, material handling delays, and worker productivity.
For example, if I see consistently high cycle times for a particular machine, coupled with frequent error logs from that machine, I’d suspect a machine-related bottleneck. Similarly, if the data shows significant delays in material delivery to a specific workstation, that points to a materials handling bottleneck. Once I’ve identified the bottleneck, I’d use data analysis techniques like Pareto charts (identifying the vital few contributing factors) to understand the root causes. Then, I can propose solutions – perhaps machine maintenance, process optimization, or improved materials management procedures. After implementing the solution, we can track the metrics again to measure the effectiveness of the intervention.
- Step 1: Data Collection and Analysis: Gather relevant shop floor data (cycle times, downtime, error rates, etc.).
- Step 2: Bottleneck Identification: Identify areas with consistently low throughput or high delays using charts and graphs in Excel or specialized software.
- Step 3: Root Cause Analysis: Determine the underlying reasons for the bottlenecks (machine failures, material shortages, process inefficiencies).
- Step 4: Solution Implementation: Implement corrective actions such as machine maintenance, process improvements, or workforce training.
- Step 5: Monitoring and Evaluation: Monitor the impact of the implemented solutions and make further adjustments as necessary.
Career Expert Tips:
- Ace those interviews! Prepare effectively by reviewing the Top 50 Most Common Interview Questions on ResumeGemini.
- Navigate your job search with confidence! Explore a wide range of Career Tips on ResumeGemini. Learn about common challenges and recommendations to overcome them.
- Craft the perfect resume! Master the Art of Resume Writing with ResumeGemini’s guide. Showcase your unique qualifications and achievements effectively.
- Don’t miss out on holiday savings! Build your dream resume with ResumeGemini’s ATS optimized templates.
Q 16. Describe your experience with using shop floor software to track inventory levels and manage materials.
My experience with shop floor software for inventory and material management spans several years and various systems. I’ve worked with both cloud-based and on-premise solutions, utilizing them to track raw materials, work-in-progress (WIP), and finished goods inventory. I’m proficient in using these systems to generate reports on inventory levels, identify potential shortages, and manage material requirements planning (MRP). For instance, I’ve used systems that integrate directly with our ERP to automatically update inventory levels based on production orders and shipments.
A key aspect of my role involves optimizing inventory levels to avoid both shortages and excess stock. In one project, I used shop floor data to create a system that triggered automated purchase orders when inventory levels fell below a pre-defined threshold, preventing production stoppages. This involved customizing reports within the shop floor software to highlight critical stock levels and integrating it with our purchasing system. I’m also experienced in configuring and using barcode scanners and RFID technology for efficient tracking of materials throughout the production process.
Q 17. How familiar are you with different inventory management techniques (e.g., FIFO, LIFO)?
I’m very familiar with various inventory management techniques, including FIFO (First-In, First-Out), LIFO (Last-In, First-Out), and weighted-average cost methods. The choice of technique greatly impacts the cost of goods sold and the value of ending inventory, and understanding their implications is crucial for accurate financial reporting and inventory optimization.
FIFO assumes that the oldest items are sold first. This is beneficial for industries with perishable goods to minimize spoilage. LIFO assumes that the newest items are sold first. This can result in a lower tax liability during periods of inflation, because the cost of goods sold is higher. Weighted-average cost provides a more smoothed-out approach by averaging the cost of all items in inventory.
I select the appropriate method based on the specific characteristics of the product and the company’s financial goals. For instance, a bakery would benefit greatly from using FIFO to avoid waste, whereas a manufacturing company dealing with stable commodity prices might find weighted average cost suitable for simplicity. I can configure shop floor software to utilize any of these methods to ensure accurate inventory costing and reporting.
Q 18. Explain your experience with quality control processes and how you use shop floor data to improve quality.
Quality control is paramount in manufacturing, and I use shop floor data extensively to improve quality outcomes. I’ve been involved in implementing and managing quality control processes involving statistical process control (SPC) charts to monitor key process parameters in real-time. By analyzing this data, we can identify patterns, trends, and potential defects before they escalate into major issues.
For example, I once used SPC charts in Excel to monitor the diameter of machined parts. When I noticed a trend towards exceeding the upper control limit, I immediately initiated a root cause analysis to understand the underlying problem, leading us to recalibrate the machine and thereby reduce defect rates significantly. I also employ data from shop floor systems to track defect rates, identify faulty batches, and analyze customer complaints to implement preventive measures and enhance overall quality.
In addition, many modern shop floor systems allow for real-time tracking of quality parameters, enabling immediate feedback and corrective actions. This proactive approach helps to prevent defects, reduce waste, and improve product quality.
Q 19. Describe your experience with using shop floor data to improve efficiency and reduce costs.
Shop floor data is a goldmine for improving efficiency and reducing costs. I use this data in several ways: firstly, to analyze production bottlenecks, as discussed earlier. Identifying and eliminating these bottlenecks directly improves production throughput and reduces wasted resources.
Secondly, I use data to optimize production scheduling. By analyzing historical data on production times, material consumption, and machine utilization, I can create more accurate production schedules. This helps to avoid delays, reduce idle time, and improve resource allocation. I’ve leveraged Microsoft Excel extensively for this, utilizing its pivot tables and charting capabilities to visualize and analyze this data effectively.
Thirdly, I use shop floor data to monitor and control energy consumption. By analyzing energy usage patterns related to specific machines or processes, we can identify areas where energy efficiency can be improved, leading to cost savings. This might involve scheduling less energy-intensive operations during peak demand periods. The data-driven approach allows for continuous improvement and proactive cost reduction strategies.
Q 20. How would you use Microsoft Outlook to effectively communicate with shop floor personnel and management?
Microsoft Outlook is a crucial tool for effective communication on the shop floor. I use it to disseminate important information quickly and efficiently to both shop floor personnel and management. I leverage its features to schedule meetings, distribute updates, and address urgent issues promptly. For example, I might use Outlook’s calendar to schedule regular meetings with shop floor supervisors to review production progress and address any challenges.
I also use Outlook to create distribution lists for different groups – such as maintenance crews, production teams, and management – allowing me to send targeted communications efficiently. I use email to send important announcements, such as production schedules, safety updates, and quality control reports. Moreover, Outlook’s task management feature is valuable for tracking action items and ensuring accountability. I often assign tasks within Outlook to follow up on identified issues or initiate specific actions.
The ability to flag important emails and use categories to organize communications ensures timely responses to urgent matters, maintaining smooth communication flows across all levels of the organization.
Q 21. Describe your experience with different data visualization techniques used in manufacturing.
Data visualization is essential for making shop floor data understandable and actionable. I’m experienced with several techniques, primarily using Microsoft Excel and specialized manufacturing analytics software.
I frequently use bar charts to compare production volumes across different shifts or product lines. Line graphs are helpful for visualizing trends in production efficiency or defect rates over time. Pie charts help to show the proportion of different types of defects or the breakdown of production time spent on various processes. Scatter plots are valuable for identifying correlations between variables, such as machine speed and defect rates.
Beyond these standard charts, I have experience with more advanced techniques, including Pareto charts (to identify the vital few contributing factors to a problem), control charts (for statistical process control), and heatmaps (to visualize data density or distribution). The selection of visualization technique depends on the nature of the data and the specific insights we are trying to extract. Ultimately, the goal is to present the data in a clear, concise, and insightful manner to aid decision-making and improve operational efficiency.
Q 22. What is your experience with implementing new shop floor software or upgrading existing systems?
Implementing new shop floor software or upgrading existing systems is a multifaceted process requiring careful planning and execution. My approach involves several key stages: initial assessment, selection, implementation, testing, and training. I start by thoroughly analyzing the current system’s strengths and weaknesses, identifying bottlenecks, and defining the requirements for a new or upgraded system. This often involves interviews with shop floor personnel to understand their daily tasks and challenges.
Next, I research and evaluate different software options, considering factors like cost, functionality, scalability, and integration with existing systems. For example, I’ve successfully implemented an ERP system in a manufacturing plant, replacing a patchwork of disparate systems. This involved migrating data, customizing the software to meet specific needs, and integrating it with existing machine control systems. The selection process often includes creating a Request for Proposal (RFP) and evaluating vendor demonstrations.
The implementation phase involves configuring the new system, setting up user accounts, and migrating data. Rigorous testing is crucial, involving both unit testing (testing individual components) and integration testing (testing the entire system). Post-implementation, ongoing monitoring and support are key to ensuring smooth operation and addressing any arising issues. For example, I’ve successfully addressed issues during the migration of large datasets, using techniques like data cleansing and validation to minimize errors.
Q 23. How would you train shop floor personnel on new shop floor software or processes?
Training shop floor personnel is paramount for successful software implementation. My approach emphasizes a multi-pronged strategy: blended learning.
- Hands-on training: I believe in practical, hands-on training using the actual software in a simulated or real environment. This allows personnel to learn by doing, tackling real-world scenarios. For example, I might create a mock production line to simulate various scenarios and problem-solve alongside the trainees.
- Modular training: I break down the training into smaller, manageable modules. This allows personnel to focus on specific tasks and gradually build their confidence. It also helps to accommodate different learning styles and paces.
- Visual aids and documentation: Clear and concise documentation including video tutorials, step-by-step guides, and cheat sheets are essential. These resources allow personnel to refer back to training materials as needed.
- On-the-job support: I ensure ongoing support through mentorship programs, regular check-ins and open communication channels to address any questions or challenges they might encounter.
- Feedback and evaluation: Regular feedback sessions are vital to adapt the training and ensure the trainees are achieving competency. Post-training evaluations help to identify areas requiring further attention.
Think of it like teaching someone to ride a bike: starting with the basics, progressing to more complex maneuvers, and always providing support and encouragement.
Q 24. How comfortable are you working with large datasets from shop floor systems?
I am very comfortable working with large datasets from shop floor systems. My experience includes using various tools and techniques to manage, analyze, and extract meaningful insights from such data. This involves familiarity with data warehousing, data mining, and data visualization techniques.
I have used tools like SQL, Power BI, and Excel to query, clean, transform, and analyze large datasets to identify trends, patterns, and anomalies. For example, I used SQL to query a database containing millions of records of machine performance data to identify machines requiring preventative maintenance. I then used Power BI to create dashboards to visualize these findings for management, enabling timely and informed decision-making.
My expertise also extends to handling data from various sources and formats, including CSV, XML, and JSON, ensuring data consistency and accuracy throughout the analysis process. This includes using techniques to handle missing data and outliers to ensure the analysis is reliable.
Q 25. Explain your understanding of data security and its importance in a manufacturing environment.
Data security is paramount in a manufacturing environment, where sensitive information like production data, intellectual property, and customer data is handled. A breach can result in significant financial losses, operational disruptions, and reputational damage.
My understanding encompasses several key aspects:
- Access Control: Implementing robust access control measures, such as role-based access control (RBAC), to restrict access to sensitive data based on user roles and responsibilities.
- Data Encryption: Using encryption techniques to protect data both in transit and at rest. This prevents unauthorized access even if a breach occurs.
- Regular Backups: Regularly backing up data to prevent data loss due to hardware failure, malware, or accidental deletion. Implementing a robust disaster recovery plan is also crucial.
- Network Security: Implementing firewalls, intrusion detection systems, and other network security measures to protect the shop floor network from external threats.
- Compliance: Adhering to relevant data privacy regulations, such as GDPR or CCPA, and implementing measures to ensure compliance.
For example, I’ve worked on projects where we implemented multi-factor authentication (MFA), data loss prevention (DLP) tools, and regular security audits to enhance data security. The goal is to create a layered security approach where multiple measures work together to protect the data.
Q 26. Describe your experience with using shop floor software to track and manage maintenance activities.
I have extensive experience using shop floor software to track and manage maintenance activities. This often involves using Computerized Maintenance Management Systems (CMMS) which are software applications specifically designed for this purpose. These systems allow for scheduling preventative maintenance, tracking repairs, managing spare parts inventory, and generating reports on maintenance costs and efficiency.
My experience includes:
- Scheduling preventative maintenance: Using CMMS software to schedule regular maintenance tasks based on equipment type, usage, and manufacturer recommendations. This helps to prevent equipment failures and extend their lifespan.
- Tracking work orders: Creating and tracking work orders for repairs, including assigning technicians, tracking progress, and managing materials used.
- Managing spare parts inventory: Using CMMS to track spare parts inventory levels, order new parts when needed, and manage inventory costs.
- Generating reports: Using CMMS to generate reports on maintenance costs, equipment downtime, and technician performance. This data is invaluable for identifying areas for improvement and optimizing maintenance strategies.
For instance, I’ve used CMMS software to reduce equipment downtime by 15% by implementing a proactive preventative maintenance program and optimizing spare parts inventory. This resulted in significant cost savings and improved production efficiency.
Q 27. How would you use shop floor data to identify areas for process improvement?
Shop floor data is a goldmine for identifying areas for process improvement. My approach involves a structured process:
- Data Collection and Cleaning: The first step is collecting relevant data from various shop floor systems and cleaning it to ensure accuracy and consistency. This might involve removing outliers, handling missing data, and transforming the data into a usable format.
- Data Analysis: Once the data is clean, I use various analytical techniques to identify trends, patterns, and anomalies. This could include statistical analysis, data mining, and visualization techniques.
- Identifying Bottlenecks: I focus on identifying bottlenecks in the production process that are causing delays or inefficiencies. This might involve analyzing machine downtime, cycle times, or material flow.
- Root Cause Analysis: Once bottlenecks are identified, I conduct a root cause analysis to understand the underlying reasons for the inefficiencies. This often involves using tools like fishbone diagrams or 5 Whys.
- Implementing Improvements: Based on the analysis, I recommend and implement specific improvements to address the identified bottlenecks. This could involve changes to production processes, equipment upgrades, or operator training.
- Monitoring and Evaluation: Finally, I monitor the effectiveness of the implemented improvements and evaluate their impact on key performance indicators (KPIs).
For example, by analyzing machine downtime data, I identified a specific machine that was frequently failing, leading to significant production delays. After investigating, I discovered that the machine required regular maintenance that was not being performed according to the schedule. Implementing a revised maintenance schedule drastically reduced downtime and improved production efficiency.
Q 28. What are your strategies for staying up-to-date with the latest advancements in shop floor software and technology?
Staying current with advancements in shop floor software and technology is crucial for maintaining a competitive edge. My strategies include:
- Industry Publications and Conferences: Regularly reading industry publications, attending conferences, and participating in webinars to learn about the latest trends and technologies.
- Online Courses and Certifications: Pursuing online courses and certifications to enhance my skills in specific areas like data analytics, cloud computing, or specific software applications.
- Networking with Peers: Engaging with peers in the manufacturing industry through professional organizations and online forums to share best practices and learn from their experiences.
- Vendor Websites and Documentation: Keeping updated with the latest features and updates provided by software vendors through their websites, documentation, and release notes.
- Pilot Projects: Participating in pilot projects to test and evaluate new software and technologies in a controlled environment before wider implementation.
I view continuous learning as an ongoing commitment. Keeping up-to-date allows me to provide valuable insights and implement the most effective solutions for my clients and employers.
Key Topics to Learn for MS Office Suite and Shop Floor Software Proficiency Interview
- MS Office Suite: Excel Mastery: Understanding advanced functions like VLOOKUP, PivotTables, and data analysis techniques. Practical application: Demonstrating the ability to create insightful reports from raw data, identify trends, and solve data-related problems.
- MS Office Suite: Word & PowerPoint: Professional document creation and presentation skills. Practical application: Creating clear, concise reports and presentations, demonstrating proficiency in formatting, and utilizing visual aids effectively.
- Shop Floor Software Proficiency: Data Entry & Management: Accurate and efficient data entry, understanding data validation rules, and managing large datasets within the shop floor system. Practical application: Explaining your experience with error handling and data reconciliation within the shop floor environment.
- Shop Floor Software Proficiency: Reporting & Analysis: Generating reports from shop floor data, interpreting key performance indicators (KPIs), and identifying areas for improvement. Practical application: Showcasing your ability to extract meaningful information from shop floor data and present it clearly.
- Shop Floor Software Proficiency: System Navigation & Troubleshooting: Demonstrate familiarity with the software’s interface, functions, and troubleshooting common issues. Practical application: Describe your problem-solving approach when faced with unexpected errors or system malfunctions.
- Integration of MS Office and Shop Floor Software: Understanding how data from the shop floor system can be effectively utilized and analyzed within MS Office applications. Practical application: Explain how you’ve used shop floor data in Excel to create reports or presentations for management.
Next Steps
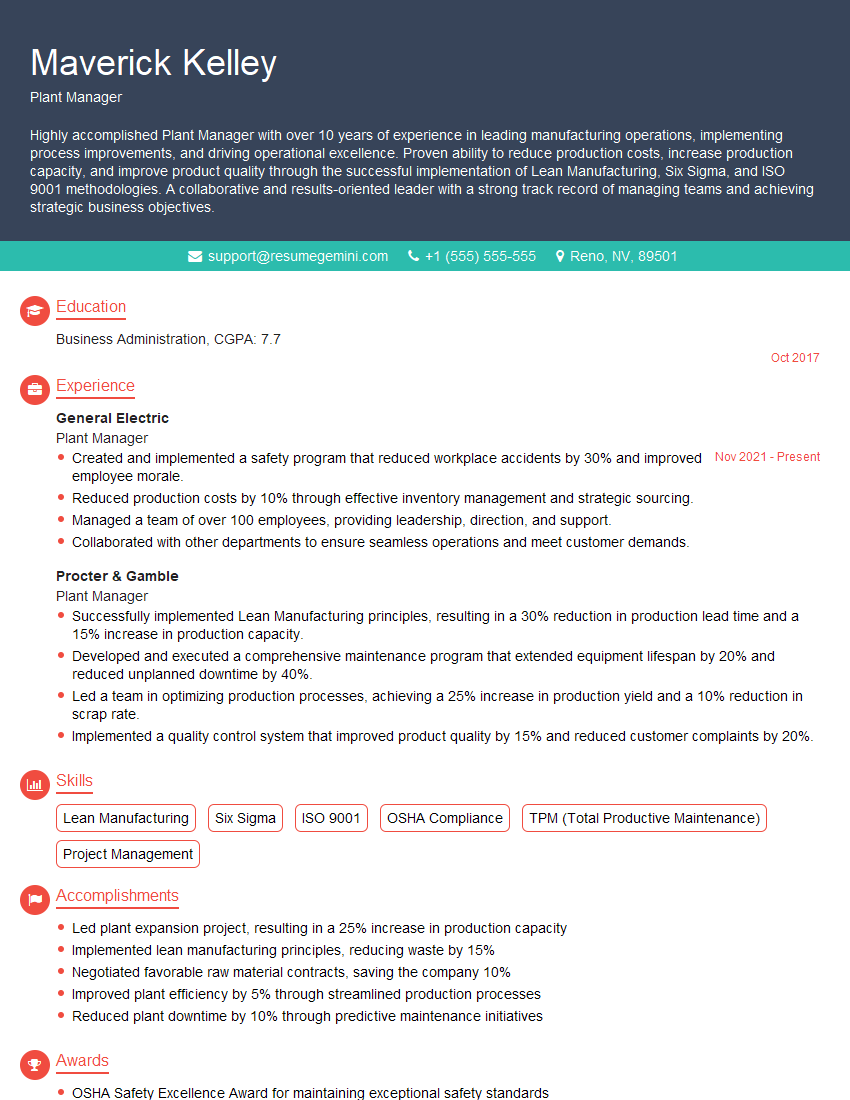
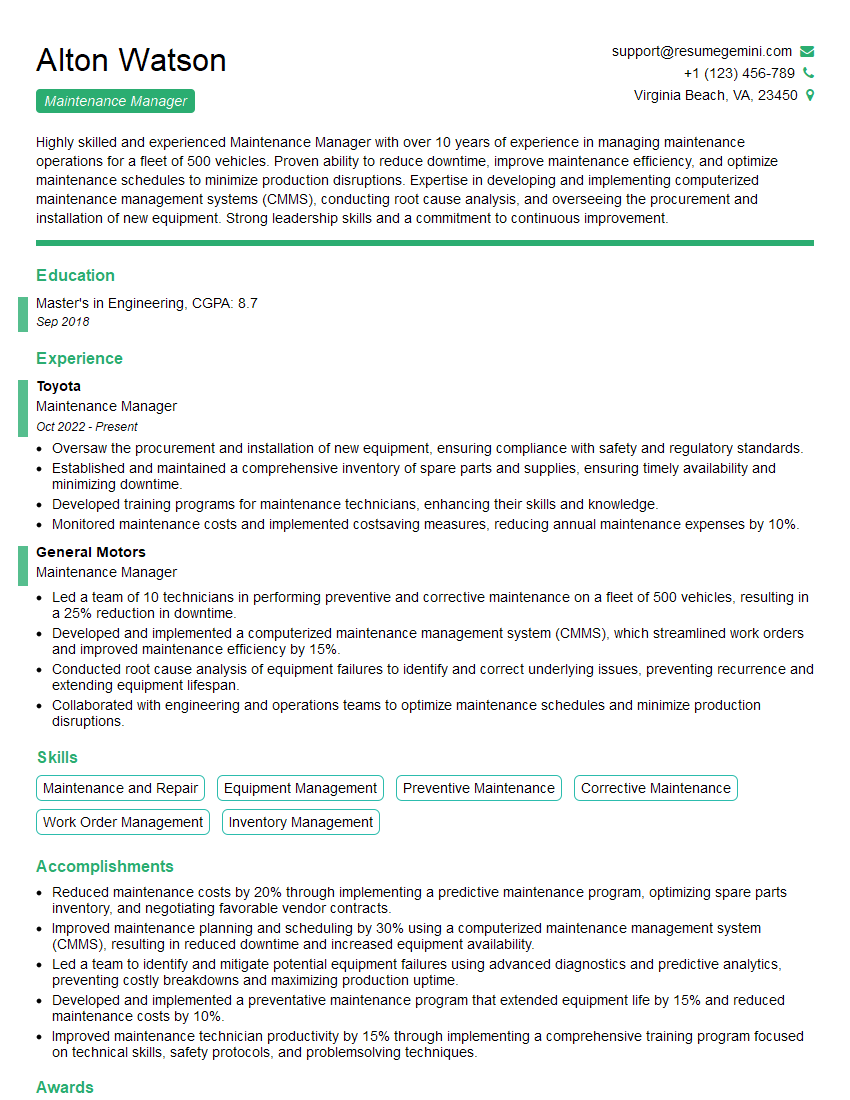
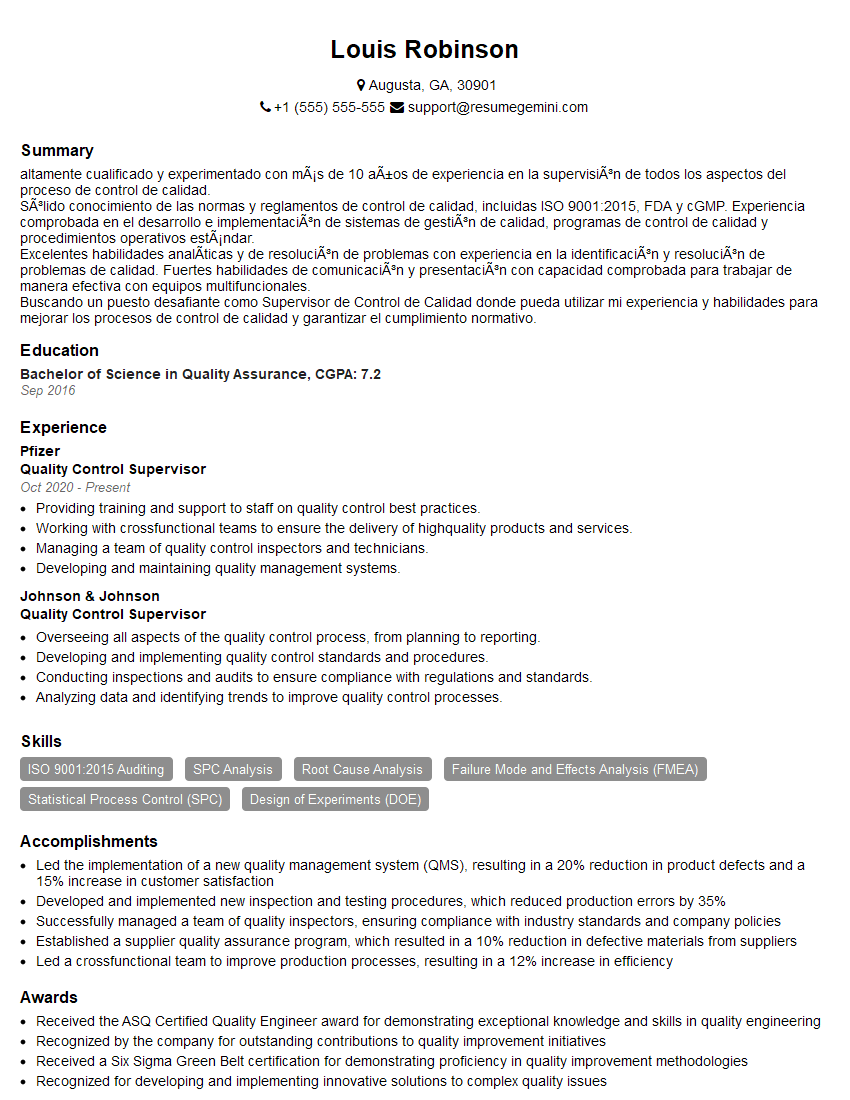
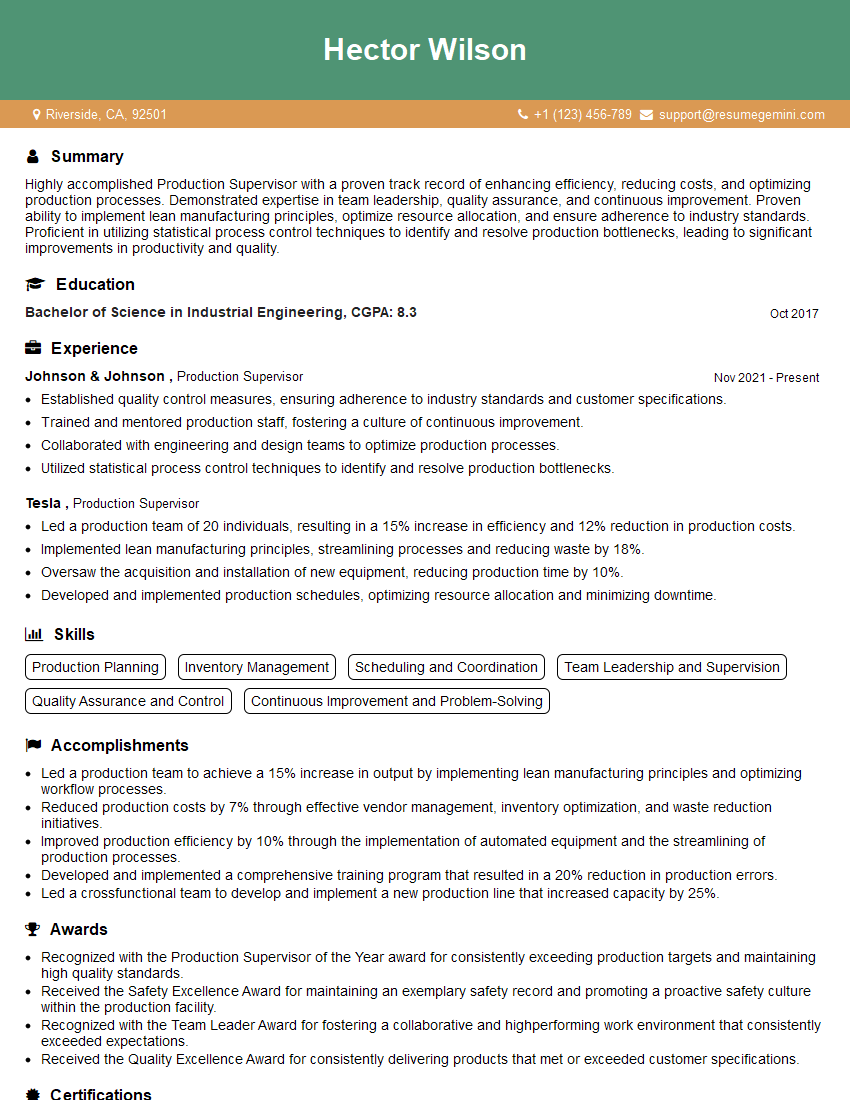
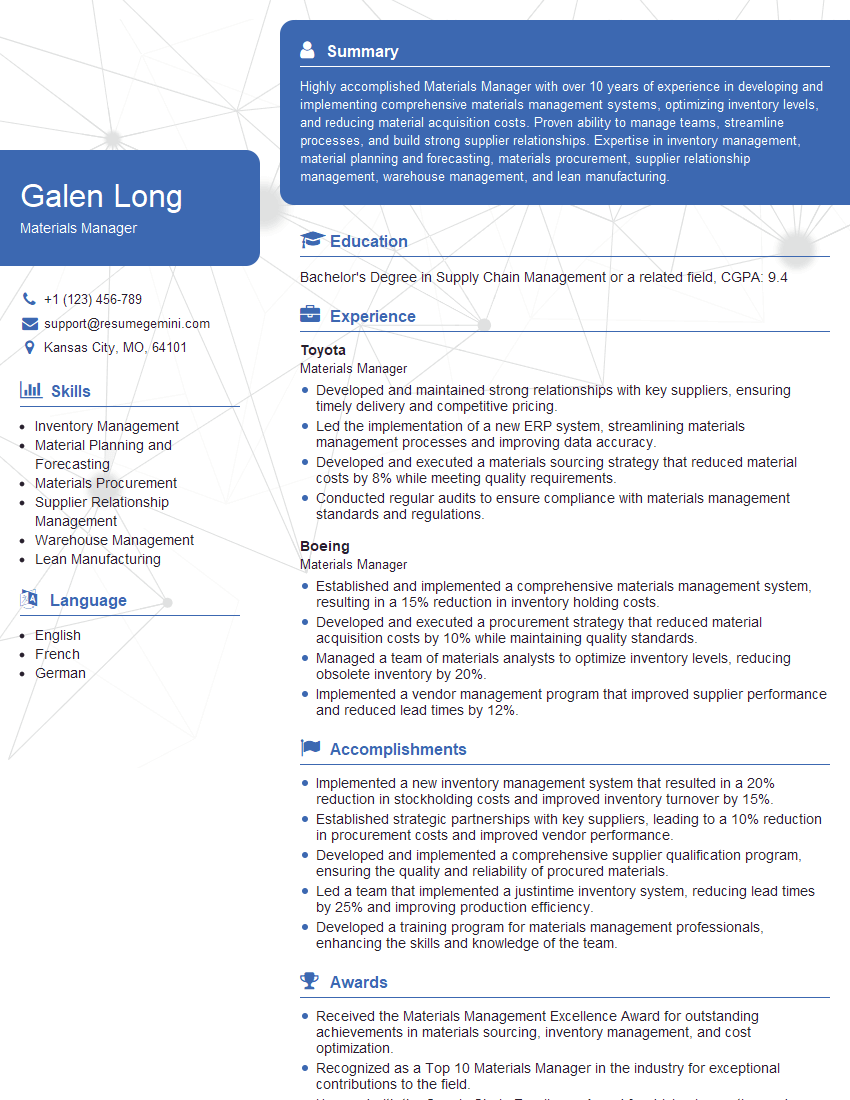
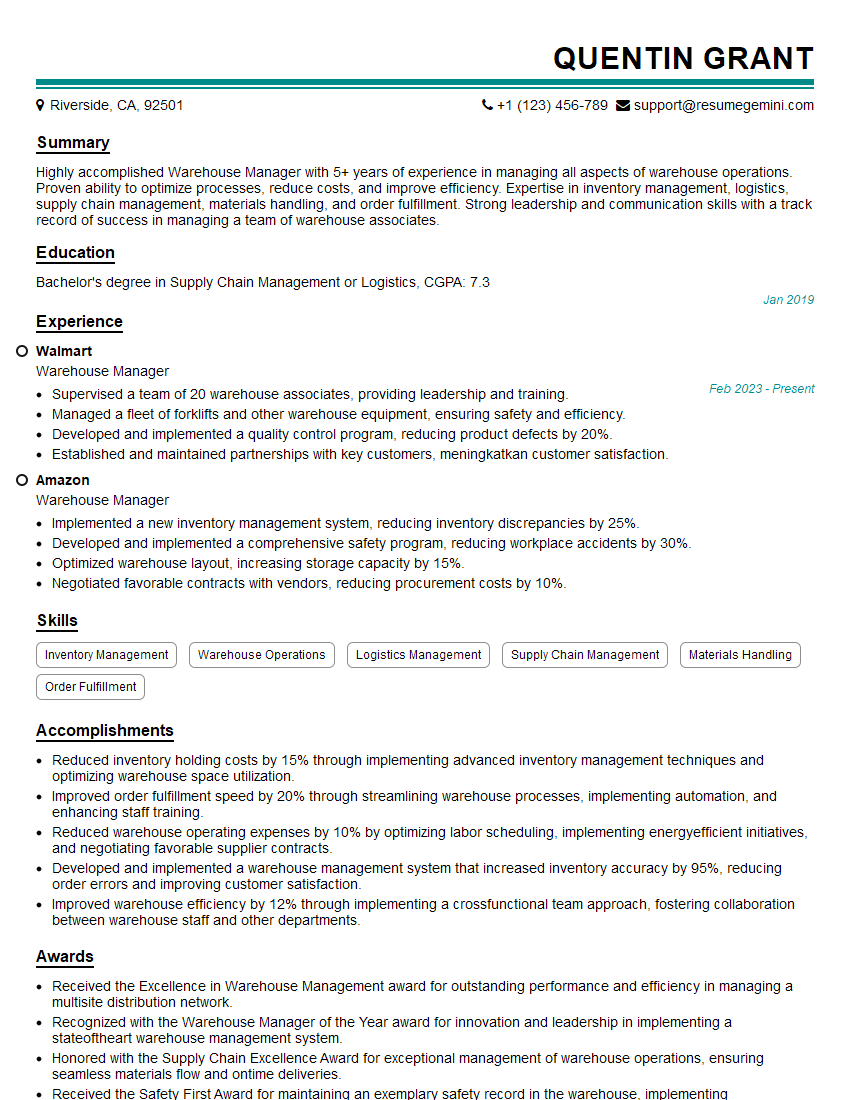
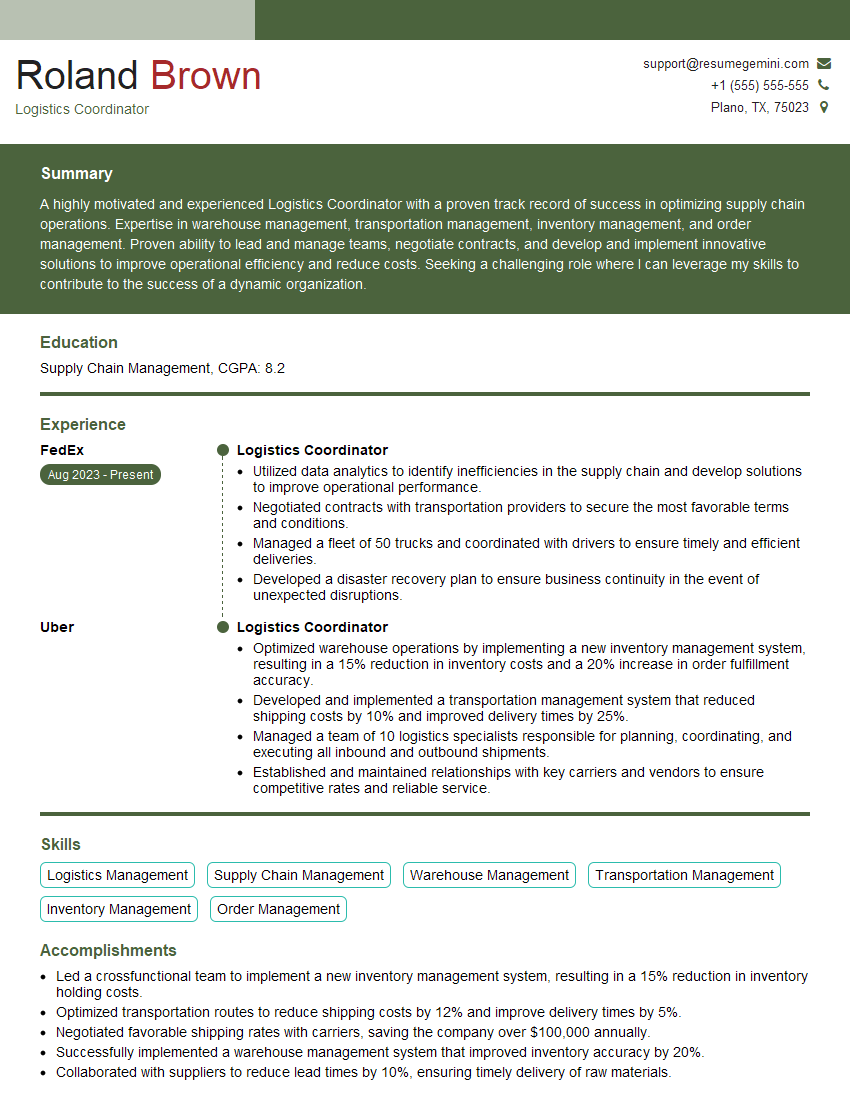
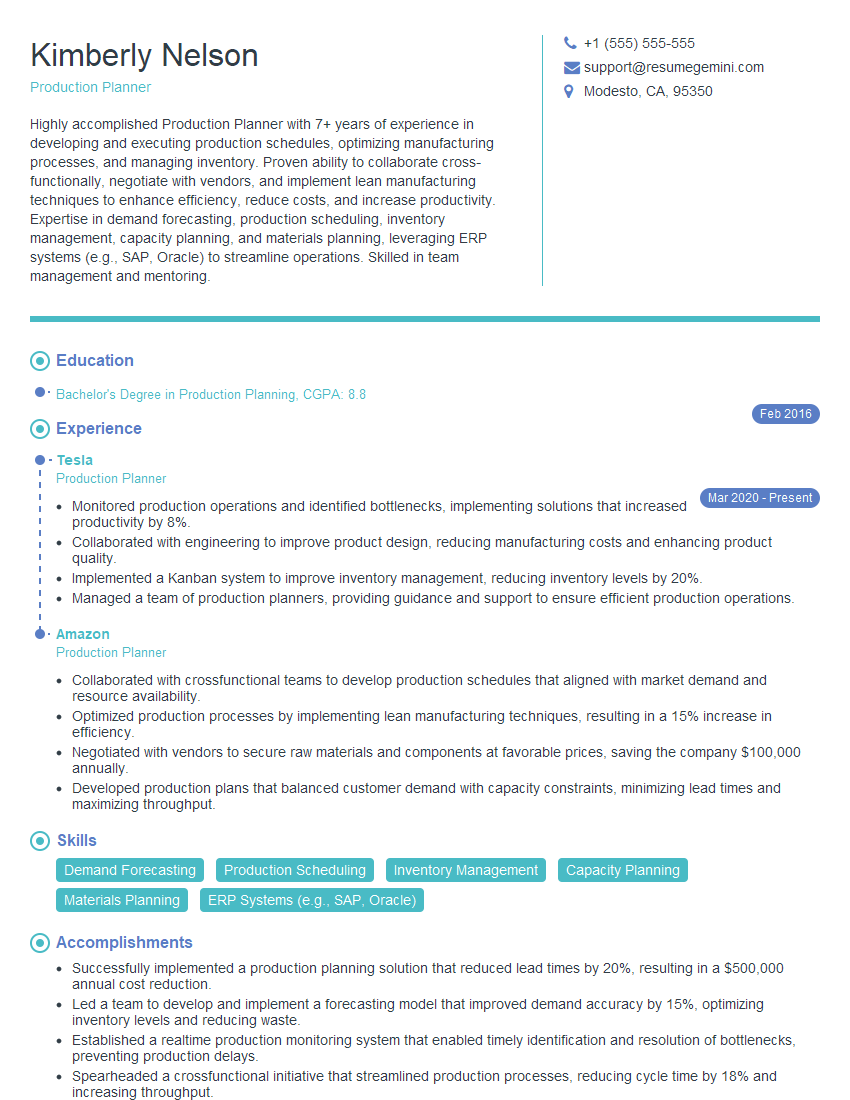
Mastering MS Office Suite and Shop Floor Software Proficiency is crucial for career advancement in many manufacturing and production roles. These skills demonstrate your ability to manage data efficiently, analyze performance, and contribute to improved operational processes. To significantly boost your job prospects, crafting an ATS-friendly resume is essential. ResumeGemini can help you build a professional and impactful resume tailored to highlight your specific skills. Examples of resumes optimized for showcasing MS Office Suite and Shop Floor Software Proficiency are available – take advantage of these resources to present yourself effectively to potential employers.
Explore more articles
Users Rating of Our Blogs
Share Your Experience
We value your feedback! Please rate our content and share your thoughts (optional).
What Readers Say About Our Blog
Hi, I’m Jay, we have a few potential clients that are interested in your services, thought you might be a good fit. I’d love to talk about the details, when do you have time to talk?
Best,
Jay
Founder | CEO

