Are you ready to stand out in your next interview? Understanding and preparing for Use analytical equipment interview questions is a game-changer. In this blog, we’ve compiled key questions and expert advice to help you showcase your skills with confidence and precision. Let’s get started on your journey to acing the interview.
Questions Asked in Use analytical equipment Interview
Q 1. Describe your experience with HPLC.
HPLC, or High-Performance Liquid Chromatography, is a powerful analytical technique I’ve extensively used for separating and quantifying components in a mixture. Imagine it like a very sophisticated, highly efficient sieve. Instead of separating by size, HPLC separates based on the interactions of the sample components with a stationary phase (packed inside a column) and a mobile phase (a liquid solvent that flows through the column). Different components have different affinities for the stationary and mobile phases, causing them to travel through the column at different speeds, leading to separation.
In my experience, I’ve utilized HPLC for various applications, including pharmaceutical analysis (determining the purity of drug compounds), environmental monitoring (analyzing pollutants in water samples), and food analysis (measuring pesticide residues in fruits and vegetables). I’m proficient in method development, optimization, and troubleshooting, ensuring the highest accuracy and precision in my results. For instance, I once had to develop a novel HPLC method to separate closely related isomers in a complex pharmaceutical sample – a challenging task that required careful selection of the stationary phase and mobile phase composition. The success of this project was incredibly satisfying and showcased my ability to tackle complex analytical challenges.
Q 2. Explain the principles of Gas Chromatography-Mass Spectrometry (GC-MS).
Gas Chromatography-Mass Spectrometry (GC-MS) is a powerful technique combining two analytical methods: gas chromatography (GC) for separation and mass spectrometry (MS) for identification and quantification. Think of it as a two-step process. First, GC separates volatile compounds in a sample based on their boiling points and interactions with a stationary phase inside a column, similar to HPLC but using a gaseous mobile phase. The separated components then enter the mass spectrometer.
The mass spectrometer (MS) measures the mass-to-charge ratio (m/z) of each component, generating a unique mass spectrum that acts like a fingerprint for each molecule. This fingerprint allows for the identification of unknown compounds by comparing the generated spectrum with a library of known compounds. Quantitation is achieved by measuring the abundance of each ion in the spectrum. I’ve used GC-MS extensively for environmental analysis (detecting volatile organic compounds in air and water samples) and forensic science (analyzing drug metabolites in biological samples). For example, in a recent project, GC-MS helped us identify the source of contamination in a manufacturing process by precisely identifying the culprit volatile organic compound.
Q 3. How do you troubleshoot a malfunctioning spectrophotometer?
Troubleshooting a malfunctioning spectrophotometer requires a systematic approach. First, I always ensure the instrument is properly calibrated and that the cuvettes are clean and free of scratches. A common problem is stray light affecting the readings. I’d check the light source, optics, and monochromator for any misalignments or contamination.
If the instrument isn’t reading correctly, I’d check the wavelength accuracy using a known standard. Calibration issues can sometimes arise from electronic components. I’d check the power supply, signal connections, and any error messages displayed by the instrument. Poor instrument performance might also be due to detector issues, which requires detailed inspection and potentially replacement. My approach involves a detailed log of all steps taken, along with observations. If needed, I consult the instrument’s manual and manufacturer’s support for additional guidance. Documenting my steps is critical for both troubleshooting and preventative maintenance.
Q 4. What are the common types of analytical balances and their applications?
Analytical balances are crucial for precise mass measurements in various applications. The most common types include:
- Macrobalances: These are general-purpose balances with a capacity of 100-200g and a readability of 0.1mg. They’re commonly used for routine weighing in various laboratories.
- Semi-microbalances: These balances have a capacity of 100g and a readability of 0.01mg, offering higher precision than macrobalances. They are suitable for applications requiring higher accuracy.
- Microbalances: These are highly sensitive balances with a capacity of 1-5g and a readability of 0.001mg (1µg). They’re frequently used in analytical chemistry for very precise weighing of small samples.
The choice of balance depends on the required precision and sample size. For example, macrobalances suffice for preparing solutions in large quantities, while microbalances are essential for preparing precise standards in trace analysis. Regular calibration and maintenance are vital for ensuring the accuracy of these instruments.
Q 5. Describe your experience with Atomic Absorption Spectroscopy (AAS).
Atomic Absorption Spectroscopy (AAS) is a powerful technique I use to determine the concentration of specific elements in a sample. The technique relies on the principle that atoms absorb light at characteristic wavelengths. A sample is atomized (usually by flame or graphite furnace), and a light beam from a hollow cathode lamp (specific to the element being analyzed) passes through the atomized sample. The amount of light absorbed is directly proportional to the concentration of the element in the sample.
My experience includes using AAS for various applications, particularly in environmental monitoring (measuring heavy metal contaminants in water and soil) and food safety (analyzing trace elements in food products). For instance, in a recent project, I used AAS to determine the concentration of lead in soil samples from a contaminated site. The results were crucial in environmental remediation planning. I am familiar with various AAS techniques, including flame AAS and graphite furnace AAS, each suitable for different applications and concentration ranges. Data interpretation and quality control measures are always prioritized.
Q 6. What is the difference between qualitative and quantitative analysis?
Qualitative analysis identifies the components present in a sample, while quantitative analysis determines the amount of each component. Imagine you have a mixture of different colored candies. Qualitative analysis would tell you what colors of candies are present (red, blue, green), while quantitative analysis would tell you how many candies of each color are there (10 red, 5 blue, 12 green).
In analytical chemistry, qualitative analysis might involve techniques like GC-MS to identify unknown compounds, while quantitative analysis might employ HPLC to determine the exact amounts of each component. Both are vital for comprehensive understanding. For example, identifying a pollutant in water (qualitative) is important, but quantifying its concentration (quantitative) is essential for risk assessment and remediation strategies.
Q 7. How do you ensure the accuracy and precision of analytical measurements?
Ensuring accuracy and precision in analytical measurements is paramount. This involves several steps:
- Proper calibration and validation of instruments: Regularly calibrating instruments with certified reference materials is crucial. Method validation ensures the method’s accuracy, precision, and robustness.
- Use of appropriate standards and controls: Using certified reference materials as standards ensures traceability to internationally recognized values. Including quality control samples throughout the analysis provides information on the precision and reproducibility of the measurements.
- Minimizing sources of error: This includes using clean glassware, avoiding contamination, correctly handling samples, and adhering to standardized operating procedures. Careful sample preparation is often a major factor impacting accuracy.
- Statistical analysis of data: Analyzing the results using appropriate statistical methods helps in assessing the uncertainty associated with the measurements and identifying potential outliers.
- Regular maintenance of equipment: Preventative maintenance helps ensure reliable instrument performance.
Implementing these measures throughout the analytical process is crucial for generating reliable and trustworthy results that can support decision making with confidence.
Q 8. Explain the concept of calibration curves in analytical chemistry.
A calibration curve is a fundamental tool in analytical chemistry that establishes the relationship between the concentration (or amount) of an analyte and its measured signal. Think of it like a recipe: you know the ingredients (analyte concentration), and the calibration curve tells you what the final dish (measured signal) should look like for each amount of ingredient. We create this curve by measuring the signal from solutions with known concentrations of the analyte. This produces a set of data points which are then plotted, typically with concentration on the x-axis and signal on the y-axis. The curve can then be used to determine the unknown concentration of an analyte in a sample by measuring its signal and interpolating (or extrapolating with caution) from the curve. Different types of curves can result, including linear, quadratic, or sigmoidal, depending on the relationship between analyte concentration and instrumental response. For example, in a spectrophotometric analysis, the calibration curve might show a linear relationship between absorbance and concentration following Beer-Lambert’s law, while in some electrochemical methods, the relationship might be more complex.
For instance, in a lab I was working in, we were quantifying trace metals in environmental samples using atomic absorption spectroscopy (AAS). We prepared a series of standard solutions with known metal concentrations, measured their absorbances, and plotted a calibration curve. This curve allowed us to accurately determine the concentration of the metal in our unknown environmental water samples by simply measuring their absorbance and referring to the curve.
Q 9. How do you handle outliers in analytical data?
Outliers in analytical data are data points that significantly deviate from the overall pattern. They can arise due to various reasons including experimental errors (e.g., pipetting mistakes), contamination, or instrument malfunction. Handling outliers requires careful consideration and should never be done arbitrarily. First, I investigate the cause. Was there a known issue during that particular measurement? If a clear error is identified, the data point is removed. If the cause remains unclear, statistical methods are employed. Visual inspection using a scatter plot is a good starting point. Then, I might apply tests like the Grubbs’ test or Chauvenet’s criterion to determine if the outlier is statistically significant and warrants exclusion. However, simply removing a data point without justification is not good scientific practice. It’s crucial to document the decision-making process, including the rationale for removing any data point and the statistical tests used. Sometimes, an outlier might indicate a genuine and interesting anomaly warranting further investigation instead of immediate removal.
Q 10. What are the different types of chromatography and their applications?
Chromatography is a powerful separation technique used extensively in analytical chemistry. It works by exploiting differences in the distribution of components of a mixture between a stationary phase and a mobile phase. Different types of chromatography exist depending on the nature of the stationary and mobile phases.
- Gas Chromatography (GC): Uses a gaseous mobile phase and a liquid or solid stationary phase. It’s excellent for separating volatile and thermally stable compounds. Applications include analyzing petroleum products, environmental pollutants, and fragrances.
- High-Performance Liquid Chromatography (HPLC): Employs a liquid mobile phase and a solid stationary phase. It’s versatile and widely used for separating non-volatile and thermally labile compounds. Applications range from pharmaceutical analysis to food quality control and environmental monitoring.
- Thin-Layer Chromatography (TLC): A simpler and less expensive technique using a thin layer of adsorbent material (stationary phase) on a plate. It’s often used for quick qualitative analysis and sample purification. It’s common in teaching labs and for rapid checks.
- Ion Chromatography (IC): Specifically designed to separate ions. The stationary phase is often an ion-exchange resin, enabling the separation of anions and cations. This finds application in environmental monitoring (measuring anions like chloride and nitrate in water) and industrial process monitoring.
The choice of chromatography technique depends heavily on the properties of the analytes and the desired level of separation.
Q 11. Describe your experience with Inductively Coupled Plasma Mass Spectrometry (ICP-MS).
I have extensive experience with Inductively Coupled Plasma Mass Spectrometry (ICP-MS). It’s a powerful technique for elemental analysis, allowing for the detection and quantification of trace elements in various samples. My experience encompasses all aspects of ICP-MS, from sample preparation and instrument operation to data analysis and method development. I’ve used it for the analysis of trace metals in various matrices, including environmental samples (water, soil, sediment), biological samples (blood, tissues), and food samples. I’m familiar with different sample introduction techniques, such as liquid nebulization and direct injection, and proficient in optimizing instrument parameters such as plasma gas flow rates, RF power, and ion lens settings to achieve optimal sensitivity and minimize interferences. In one project, we used ICP-MS to quantify platinum group elements in geological samples to assess the economic viability of a mining site, requiring meticulous sample preparation and careful control over potential interferences. I’m also experienced in handling and interpreting isotopic ratios obtained from ICP-MS for isotopic tracing studies.
Q 12. What are the safety precautions when using analytical equipment?
Safety is paramount when using analytical equipment. Precautions vary depending on the specific instrument, but some general principles apply. Always follow the manufacturer’s instructions carefully. Proper personal protective equipment (PPE) is crucial, including safety glasses, lab coats, and gloves. Many instruments handle hazardous chemicals or high voltages, demanding appropriate handling procedures. For example, when working with ICP-MS, always ensure the proper ventilation to remove generated argon gas. Acids should be handled with extreme care, using fume hoods when necessary and following proper dilution techniques. Regular maintenance and calibration of the equipment are essential to prevent malfunctions and accidents. Appropriate training is crucial before operating any analytical equipment. Emergency procedures should be clearly understood and readily accessible. It’s vital to report any incidents or near misses immediately to ensure a safe working environment.
Q 13. Explain the importance of method validation in analytical chemistry.
Method validation is a critical step in analytical chemistry. It’s the process of confirming that an analytical method is suitable for its intended purpose. This ensures the reliability, accuracy, and precision of the results. A poorly validated method can lead to erroneous conclusions and potentially unsafe outcomes. Validation typically involves assessing various parameters, including:
- Specificity: Demonstrating that the method only measures the target analyte and not interfering substances.
- Linearity: Assessing the linearity of the response over the intended concentration range.
- Accuracy: Determining the closeness of the measured value to the true value.
- Precision: Evaluating the reproducibility of the measurements.
- Limit of Detection (LOD) and Limit of Quantification (LOQ): Determining the lowest concentration that can be reliably detected and quantified.
- Robustness: Assessing the method’s resilience to minor variations in experimental conditions.
A properly validated method builds confidence in the results obtained, allowing for reliable decision-making in various fields, including quality control, environmental monitoring, and clinical diagnostics.
Q 14. How do you prepare samples for analysis?
Sample preparation is a crucial step that significantly impacts the accuracy and reliability of analytical results. The method depends heavily on the sample type and the analytical technique employed. It typically involves several steps:
- Sampling: Obtaining a representative sample from the bulk material. This step requires careful planning to avoid bias.
- Sample Pretreatment: This could involve steps such as drying, homogenization, or extraction to separate the analyte from the matrix. For instance, solid samples might be digested using acids to dissolve the analytes into solution for analysis by ICP-MS. Liquid samples might require filtration or centrifugation to remove particulate matter.
- Sample Clean-up: Eliminating interfering substances that could affect the analysis. Techniques include solid-phase extraction (SPE) or liquid-liquid extraction (LLE).
- Dilution: Adjusting the concentration of the sample to fall within the calibration range of the analytical instrument.
Each step should be optimized to minimize sample loss, contamination, and degradation, ensuring representative and accurate results. For example, in environmental analysis, the sample preparation method needs to be tailored to the specific environmental matrix (soil, water, air) and the targeted pollutants.
Q 15. What software packages are you proficient in for data analysis?
For data analysis, I’m proficient in several software packages, each offering unique strengths. My core competency lies in OriginPro, which I use extensively for data visualization, curve fitting, and advanced statistical analysis. I regularly utilize its scripting capabilities for automation of repetitive tasks. I’m also adept at using MATLAB for more complex mathematical modeling and signal processing, particularly useful when dealing with spectroscopic data. Furthermore, my experience includes Python with libraries like NumPy, SciPy, and Pandas for data manipulation, statistical analysis, and creating customized workflows. Finally, I have experience with GraphPad Prism, a user-friendly tool ideal for generating publication-ready graphs and performing statistical tests.
For instance, in a recent project involving HPLC analysis, I used Python with Pandas to clean and organize the raw data, then leveraged OriginPro’s advanced fitting algorithms to accurately determine analyte concentrations. This automated a process that previously required significant manual effort, resulting in improved efficiency and accuracy.
Career Expert Tips:
- Ace those interviews! Prepare effectively by reviewing the Top 50 Most Common Interview Questions on ResumeGemini.
- Navigate your job search with confidence! Explore a wide range of Career Tips on ResumeGemini. Learn about common challenges and recommendations to overcome them.
- Craft the perfect resume! Master the Art of Resume Writing with ResumeGemini’s guide. Showcase your unique qualifications and achievements effectively.
- Don’t miss out on holiday savings! Build your dream resume with ResumeGemini’s ATS optimized templates.
Q 16. Describe your experience with titrations and their applications.
Titration is a quantitative chemical analysis technique where a solution of known concentration (the titrant) is added to a solution of unknown concentration (the analyte) until the reaction between them is complete. This endpoint is typically detected by a change in color using an indicator or through instrumental methods like potentiometry (pH meter). Titrations are invaluable for determining the concentration of a wide range of substances, from acids and bases to redox-active species.
My experience includes various titration types, including acid-base titrations (e.g., determining the concentration of vinegar using a standardized NaOH solution), redox titrations (e.g., using potassium permanganate to determine the iron content in an ore sample), and complexometric titrations (e.g., determining water hardness using EDTA).
For example, during my work at [Previous Company Name], I used potentiometric titration to determine the exact concentration of a highly reactive pharmaceutical intermediate. The precise concentration was crucial for optimizing the subsequent synthesis steps. The precision and accuracy afforded by potentiometric titration ensured the consistency and quality of the final product.
Q 17. Explain the principles of mass spectrometry.
Mass spectrometry (MS) is an analytical technique used to measure the mass-to-charge ratio (m/z) of ions. This allows for the identification and quantification of molecules in a sample. The basic principles involve ionizing the sample, separating the ions based on their m/z ratio using an analyzer (e.g., quadrupole, time-of-flight), and detecting the abundance of each ion.
The process typically begins with sample introduction (e.g., direct injection, gas chromatography, liquid chromatography). Then, ionization techniques like electrospray ionization (ESI) or matrix-assisted laser desorption/ionization (MALDI) create ions from the sample molecules. These ions are then accelerated and separated in a mass analyzer, after which a detector measures the abundance of each ion based on its m/z ratio. Finally, software processes the data to generate a mass spectrum, showing the relative abundance of each ion as a function of its m/z.
Imagine it like a sorting machine for molecules: each molecule gets a unique ‘weight’ (m/z), and the machine sorts them according to their weight, allowing us to count how many of each type are present.
Q 18. How do you maintain and calibrate analytical instruments?
Maintaining and calibrating analytical instruments is crucial for ensuring accurate and reliable results. This involves a multi-faceted approach. Regular preventative maintenance, following the manufacturer’s instructions, is key. This may include cleaning optical components, checking gas flows, replacing consumables (e.g., columns in chromatography), and regularly inspecting for wear and tear.
Calibration involves using certified reference materials (CRMs) to verify the accuracy of the instrument’s measurements. For example, for a spectrophotometer, we would use CRMs with known absorbance values at specific wavelengths. The instrument’s readings are compared to these known values, and adjustments are made if necessary to ensure accuracy. Calibration frequency depends on the instrument and its usage, but it’s usually performed regularly or before critical analyses. Detailed logbooks meticulously track all maintenance and calibration procedures, ensuring traceability and compliance.
Failure to properly maintain and calibrate instruments can lead to inaccurate results, potentially jeopardizing the validity of experiments or product quality.
Q 19. What are the limitations of different analytical techniques?
Every analytical technique has its limitations. For example, UV-Vis spectroscopy is limited by the need for chromophores (light-absorbing groups) in the analyte and can suffer from spectral overlap if multiple compounds are present. Gas chromatography (GC) requires volatile and thermally stable compounds; non-volatile or thermally labile substances are unsuitable. High-performance liquid chromatography (HPLC), while more versatile than GC, can have issues with peak broadening and requires careful method development. Mass spectrometry, while highly sensitive, might require derivatization for some analytes and can be susceptible to matrix effects.
Understanding these limitations is crucial for selecting the appropriate technique for a specific application and interpreting results critically. For example, if I needed to analyze a complex mixture of non-volatile compounds, I wouldn’t choose GC; HPLC or a separation method coupled with MS would be more suitable.
Q 20. Describe your experience with FTIR Spectroscopy.
FTIR spectroscopy, or Fourier Transform Infrared Spectroscopy, is a powerful technique that measures the absorption of infrared light by a sample. This absorption is characteristic of the functional groups present in the molecule, providing a molecular fingerprint. The technique involves passing infrared light through a sample and measuring the absorbance at different frequencies. The resulting spectrum is a plot of absorbance versus wavenumber (cm-1), which shows peaks corresponding to specific vibrational modes of the molecules.
My experience includes using FTIR for both qualitative and quantitative analyses. For example, I’ve used FTIR to identify unknown compounds by comparing their spectra to databases of known compounds. I’ve also used FTIR for quantitative analysis, for instance, determining the concentration of a specific component in a polymer blend by measuring the intensity of characteristic peaks. We used FTIR to analyze the composition of a pharmaceutical product, ensuring it met the required specifications.
Q 21. How do you interpret and report analytical results?
Interpreting and reporting analytical results involves several key steps. Firstly, the raw data needs to be processed; this could include baseline correction, peak integration, and calibration. Then, the processed data is used to calculate relevant parameters, such as concentration, purity, or other relevant properties. Statistical analysis might be necessary to assess the reliability of the results and quantify the uncertainty associated with them.
The results are then presented in a clear, concise, and unambiguous manner, often in a formal report. This report should include a detailed description of the methods employed, relevant experimental parameters, the processed data, any statistical analysis, and a discussion of the findings. The report should also address any limitations or uncertainties associated with the results and their implications. Ultimately, the goal is to present a comprehensive and accurate representation of the findings in a manner easily understood by the intended audience.
For example, in a recent study, I used HPLC to analyze the purity of a synthesized compound. My report detailed the HPLC method, presented the chromatogram with peak identification and integration data, calculated the purity, along with associated uncertainty. The report also included a discussion of potential sources of error and their impact on the results.
Q 22. What is the difference between accuracy and precision?
Accuracy and precision are crucial concepts in analytical chemistry, often confused but distinctly different. Accuracy refers to how close a measurement is to the true value. Think of it like hitting the bullseye on a dartboard – a highly accurate measurement lands right in the center. Precision, on the other hand, describes how close repeated measurements are to each other. This is like consistently hitting the same spot on the dartboard, even if that spot isn’t the bullseye. A set of measurements can be precise but inaccurate (e.g., consistently missing the bullseye by the same amount) or accurate but imprecise (e.g., hitting all around the bullseye but not consistently in one spot). Ideally, we aim for both high accuracy and high precision.
Example: Imagine you’re measuring the mass of a 10g weight. An accurate measurement would yield a result very close to 10g. A precise set of measurements might give you readings like 9.98g, 9.99g, and 10.01g, which are close to each other but might not be exactly accurate. Conversely, readings like 9.5g, 10.5g, and 11g are neither precise nor accurate.
Q 23. Explain the concept of limit of detection (LOD) and limit of quantitation (LOQ).
The Limit of Detection (LOD) and Limit of Quantitation (LOQ) are critical parameters defining the sensitivity of an analytical method. The LOD is the lowest concentration of an analyte that can be reliably detected, though not necessarily quantified accurately. It represents the point where a signal is significantly different from the background noise. The LOQ, on the other hand, is the lowest concentration that can be reliably quantified with acceptable accuracy and precision. The LOQ is usually set at a higher concentration than the LOD.
Think of it like this: Imagine trying to hear a faint whisper in a noisy room. The LOD is the point where you can *just* detect that there’s a sound, a whisper. You can hear *something*, but you can’t make out the words clearly. The LOQ is the point where you can hear the whisper clearly enough to understand the words – you can accurately quantify the information.
In practice, LOD and LOQ are typically determined statistically from the blank measurements and calibration curves. They are essential for method validation and ensuring the reliability of analytical results.
Q 24. Describe your experience with NMR spectroscopy.
I have extensive experience with NMR (Nuclear Magnetic Resonance) spectroscopy, having utilized it for both structural elucidation and quantitative analysis. My experience spans various NMR techniques, including 1H, 13C, and 31P NMR. I’m proficient in operating high-field NMR spectrometers, processing data using software like Mestrenova and Topspin, and interpreting complex spectra to identify functional groups and determine the purity of compounds. For example, during my research on the synthesis of novel organic compounds, I employed 1H and 13C NMR to confirm the structural identity and purity of the synthesized molecules. We used 2D NMR techniques such as COSY and HSQC to resolve overlapping peaks and establish connectivity between different protons and carbons within the molecules. The results were crucial in validating the synthetic pathways and characterising the novel structures. I also have experience optimizing NMR parameters to improve signal-to-noise ratio and spectral resolution, leading to more accurate and reliable results.
Q 25. How do you manage data integrity in a laboratory setting?
Data integrity is paramount in any laboratory setting. My approach to managing it involves a multi-faceted strategy encompassing meticulous record-keeping, proper instrument calibration and maintenance, robust quality control procedures, and the use of electronic laboratory notebooks (ELNs).
- Record-keeping: All experimental procedures, raw data, calculations, and interpretations are meticulously documented, often using an ELN to ensure traceability and audibility. This includes version control to track changes over time.
- Instrument Calibration & Maintenance: Regular calibration and preventive maintenance of analytical instruments are crucial to minimize errors. Calibration data and maintenance logs are carefully recorded.
- Quality Control (QC): We implement rigorous QC procedures, which involve using certified reference materials, performing blank runs, and replicating measurements. This provides a level of assurance about the accuracy and reliability of the results.
- Electronic Laboratory Notebooks (ELNs): ELNs are essential tools to ensure data security, traceability, and collaboration.
Following these procedures helps avoid data manipulation and ensures the validity and integrity of research.
Q 26. Explain the principles of electrophoresis.
Electrophoresis is a technique used to separate charged molecules based on their size and charge using an electric field. The sample is applied to a medium, such as a gel or a capillary tube, that acts as a support matrix. When an electric field is applied, charged molecules migrate towards the electrode with the opposite charge. Smaller molecules move faster through the matrix than larger ones. Additionally, the rate of migration is influenced by the strength of the charge on the molecule – molecules with higher charge move faster.
Different types of electrophoresis exist, including:
- Gel electrophoresis: commonly used to separate proteins and nucleic acids based on size and charge. The matrix is a gel, often agarose or polyacrylamide.
- Capillary electrophoresis: uses a narrow capillary tube filled with an electrolyte. It provides high resolution and speed of separation.
- Isoelectric focusing: separates proteins based on their isoelectric point (pI), the pH at which the net charge is zero. This technique uses a pH gradient in the separation medium.
Electrophoresis is widely used in various applications, such as DNA fingerprinting, protein analysis, and clinical diagnostics.
Q 27. Describe your experience with different types of microscopes.
My experience with microscopes encompasses a range of techniques, including light microscopy (bright field, dark field, phase contrast, fluorescence), electron microscopy (SEM and TEM), and confocal microscopy. I’m proficient in sample preparation for each technique, image acquisition, and image analysis.
For instance, I’ve used bright-field microscopy for routine observation of cellular structures and tissue samples. Fluorescence microscopy has been critical for visualizing specific proteins or molecules labelled with fluorescent tags, particularly in cell biology experiments. Electron microscopy (SEM & TEM) offered significantly higher resolution imaging for examining detailed ultrastructure of materials and cells. Confocal microscopy allowed for 3D imaging of specimens with reduced out-of-focus light. My experience with these techniques has been fundamental in my work, providing crucial visual data to support various experiments and analyses.
Q 28. How would you address a discrepancy between two analytical results?
Addressing discrepancies between analytical results requires a systematic approach focusing on identifying the source of the error. My strategy involves the following steps:
- Re-examine the Data: Carefully review all raw data, calculations, and instrument parameters for both results. Look for obvious errors, such as transcription mistakes or miscalculations.
- Investigate the Sample: Ensure the samples were properly collected, stored, and handled. Contamination or degradation could have influenced the results.
- Assess Instrument Performance: Verify the proper functioning and calibration of the instruments used. Check instrument logs and perform a calibration check if necessary.
- Consider Methodological Limitations: Examine the limitations of the analytical method used. The precision and accuracy of the method should be considered, as well as any potential interferences that might affect the results.
- Perform Additional Analyses: If the discrepancy persists, perform independent analyses using a different method or instrument to validate the findings. This could involve sending samples to an external laboratory.
- Document Findings: Thoroughly document all investigation steps, findings, and conclusions. Any corrective actions taken should also be documented.
This systematic approach helps to pinpoint the root cause of discrepancies and ensures the reliability of the final reported results. It’s vital to document all steps taken to resolve the discrepancy transparently and accurately.
Key Topics to Learn for Use analytical equipment Interview
- Understanding Analytical Equipment Principles: Grasp the fundamental theoretical concepts behind the operation of various analytical instruments. This includes understanding the underlying scientific principles and limitations of each technique.
- Calibration and Validation Procedures: Learn the practical steps involved in calibrating and validating analytical equipment to ensure accurate and reliable results. This includes understanding quality control measures and documentation.
- Data Acquisition and Analysis: Master the techniques for acquiring, processing, and interpreting data generated by analytical equipment. Practice interpreting results, identifying potential errors, and drawing meaningful conclusions.
- Troubleshooting and Maintenance: Develop skills in troubleshooting common issues with analytical equipment and performing routine maintenance procedures to ensure optimal performance and longevity.
- Sample Preparation Techniques: Understand the importance of proper sample preparation and its impact on the accuracy and reliability of analytical results. Learn different sample preparation methods relevant to the specific equipment.
- Safety Procedures and Regulations: Familiarize yourself with the safety protocols and regulations associated with the operation and maintenance of analytical equipment. This includes handling hazardous materials and waste disposal.
- Specific Analytical Techniques: Depending on the role, focus on specific analytical techniques like chromatography (GC, HPLC), spectroscopy (UV-Vis, IR, NMR), mass spectrometry, or electrochemical methods. Understand their applications and limitations.
- Data Interpretation and Reporting: Practice presenting your findings clearly and concisely, both verbally and in written reports. Learn to communicate complex technical information to a non-technical audience.
Next Steps
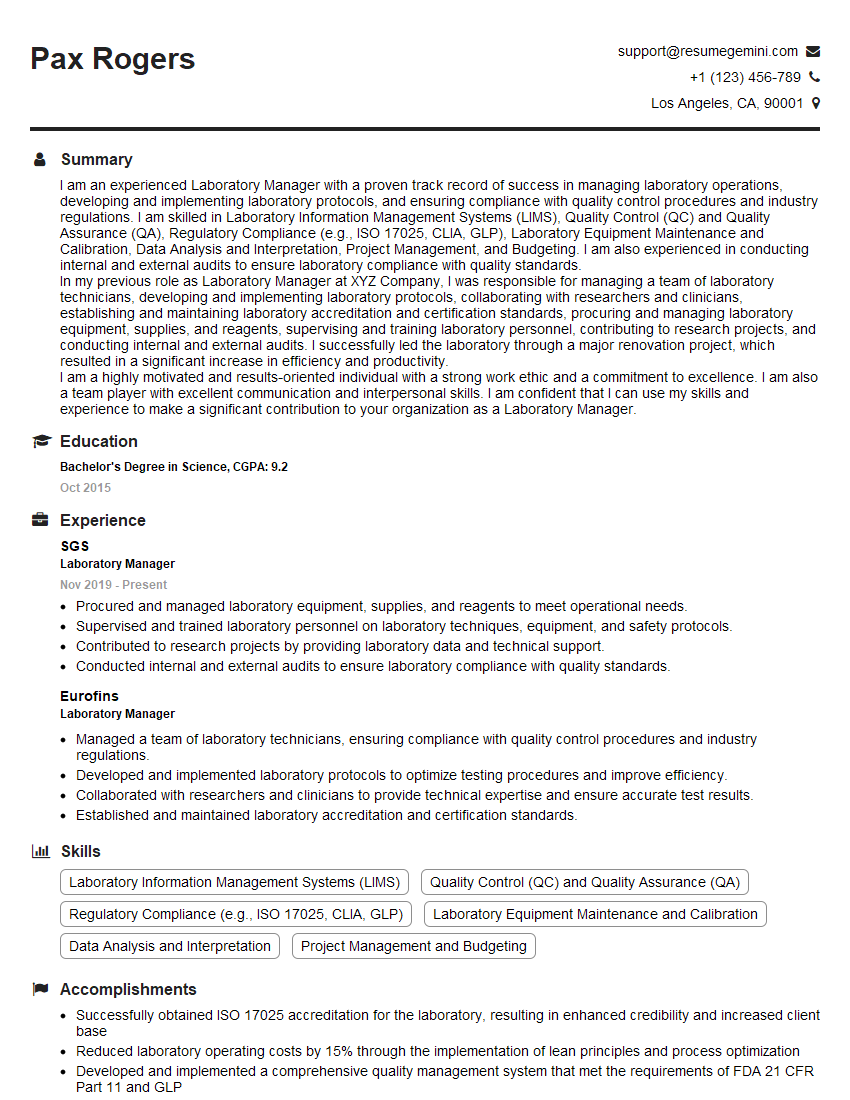
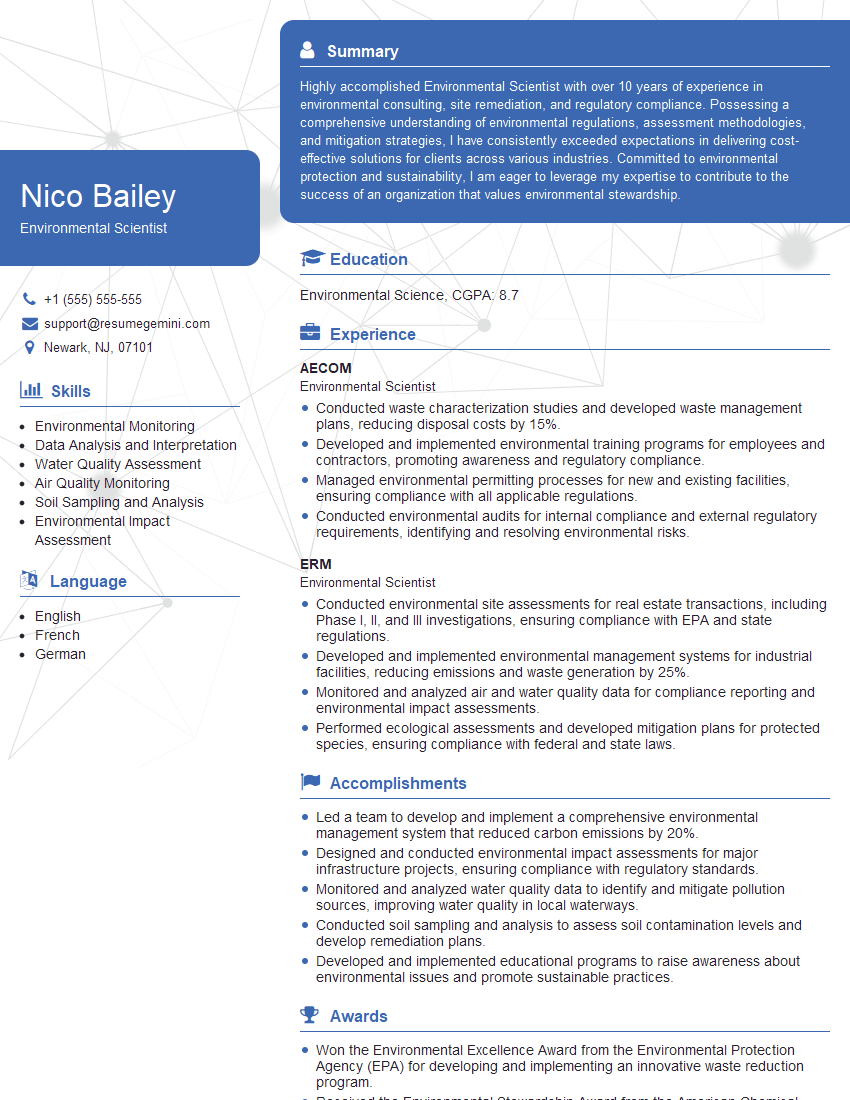
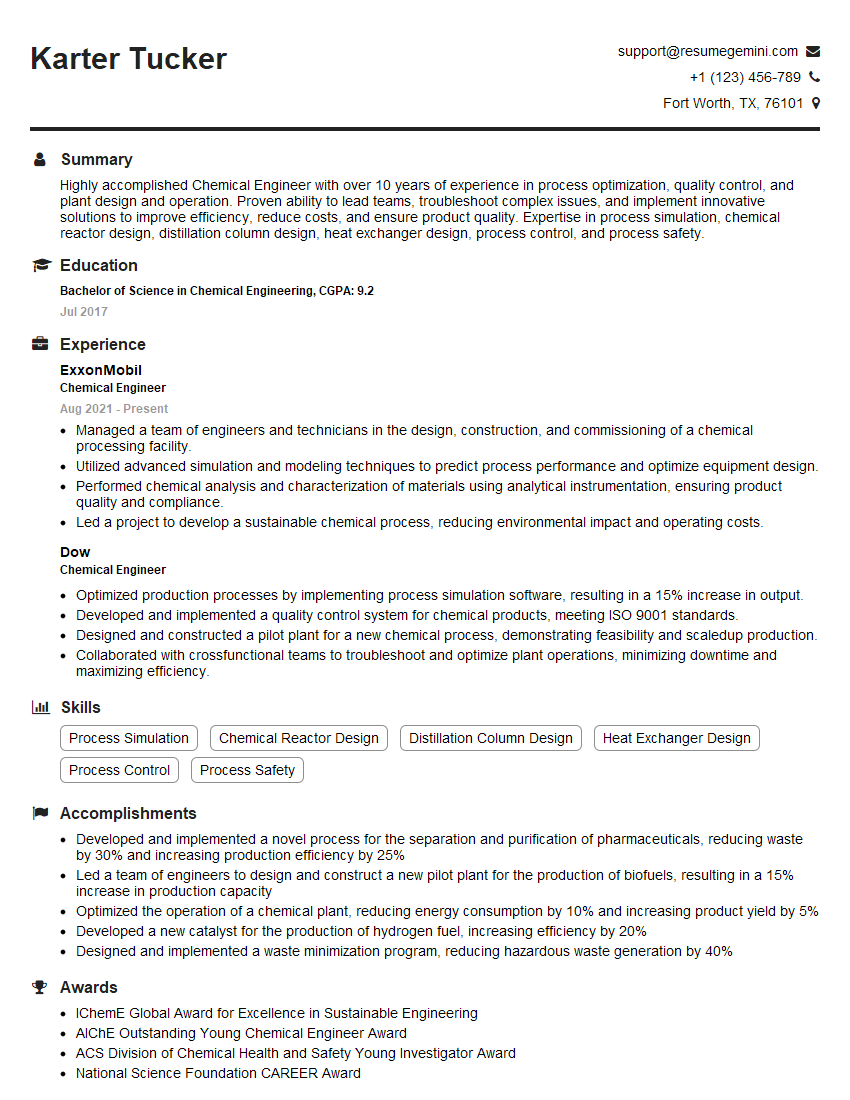
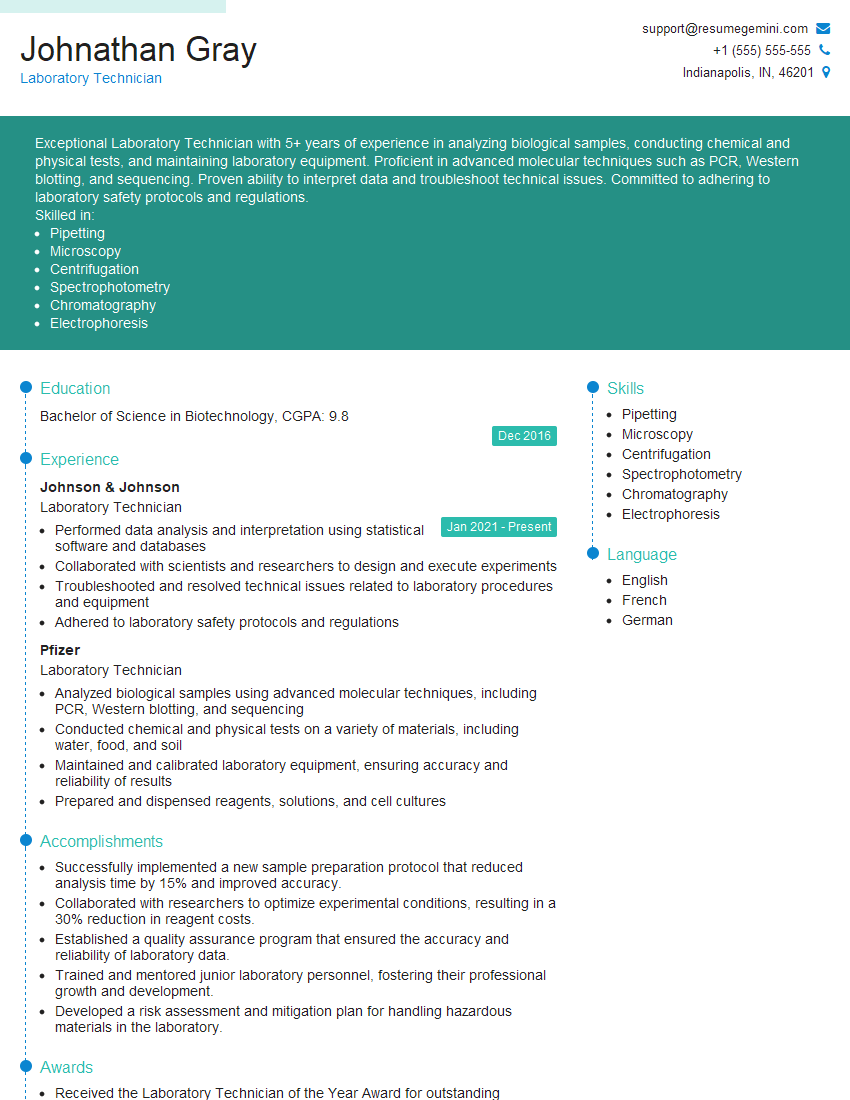
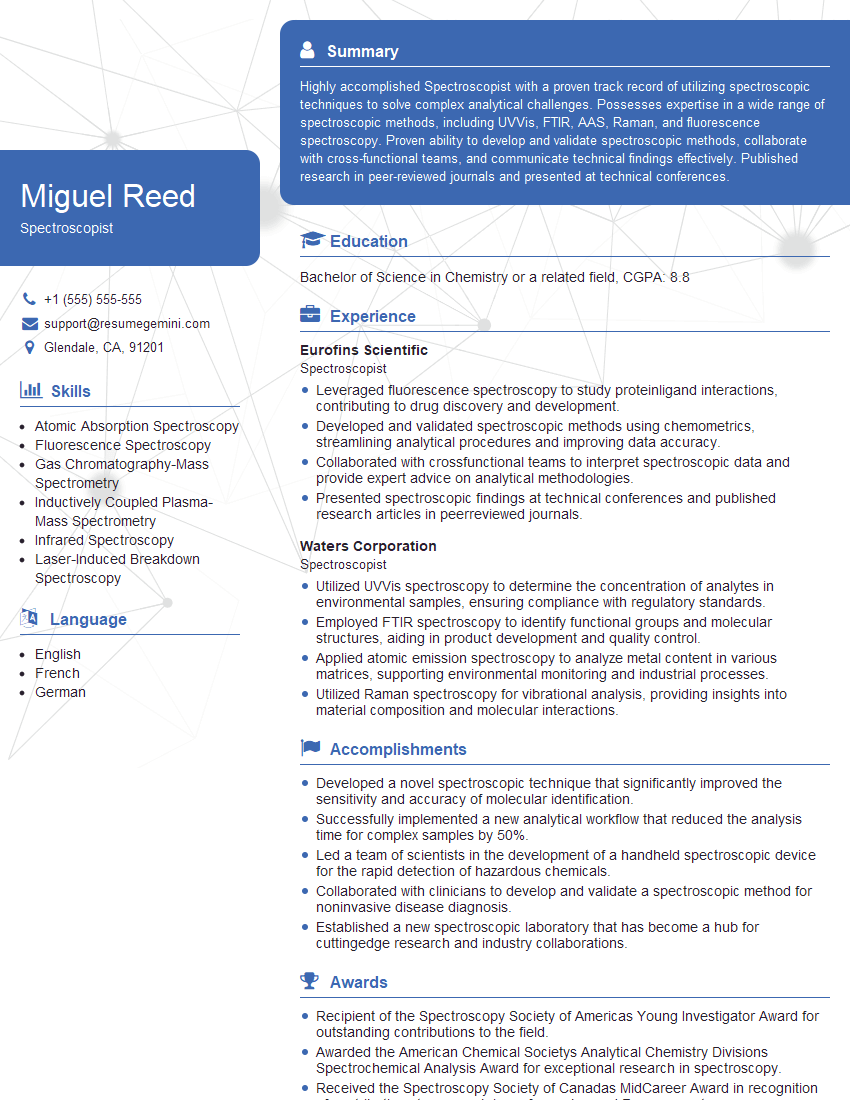
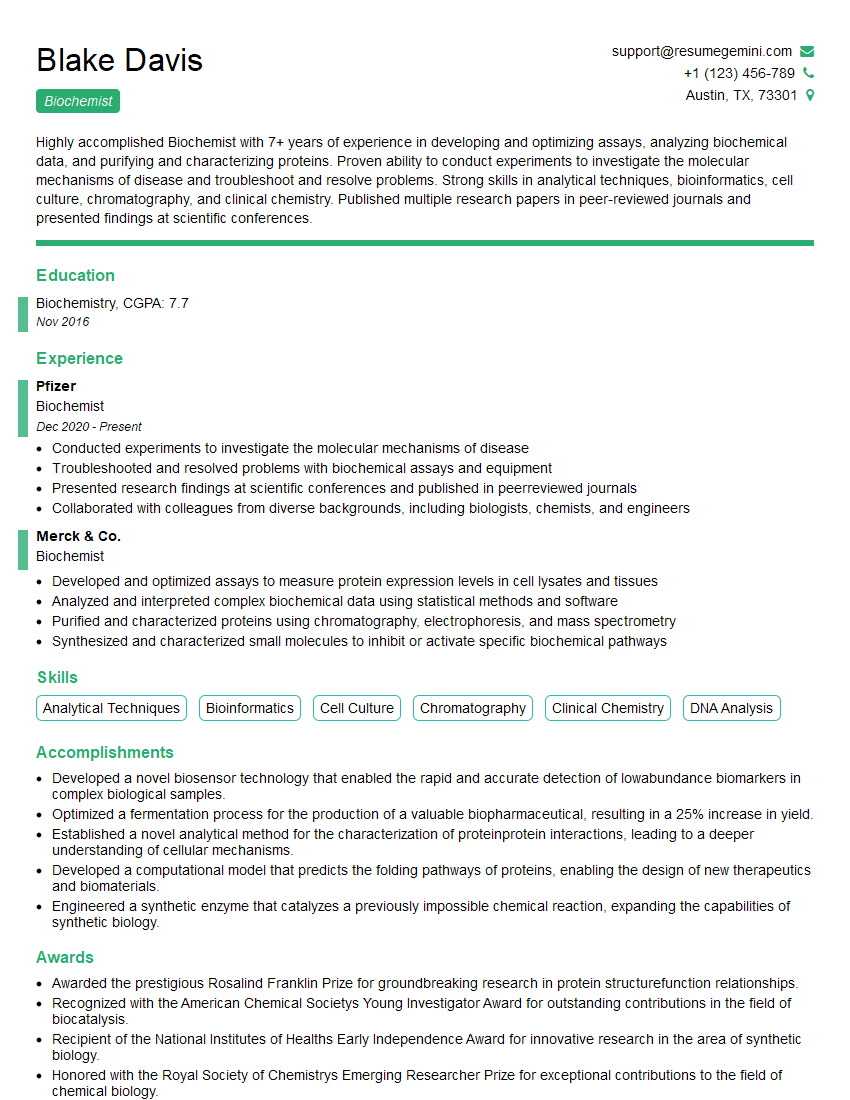
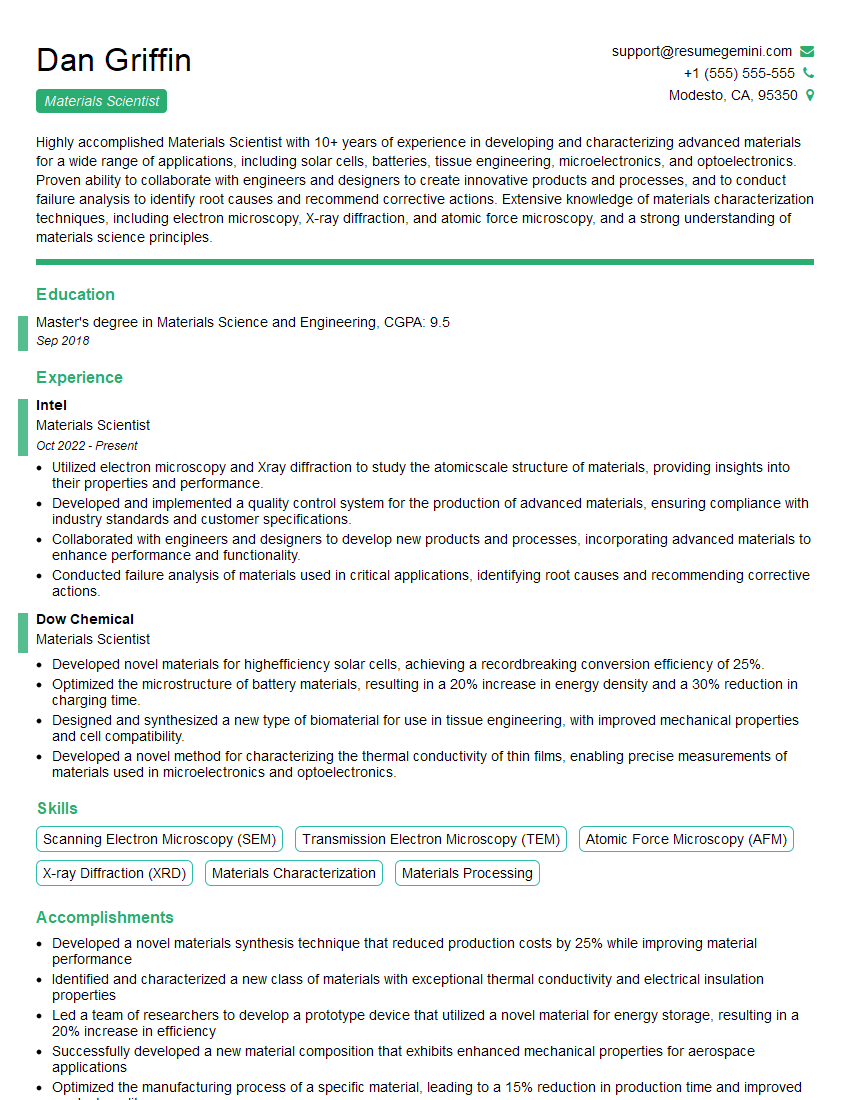
Mastering the use of analytical equipment is crucial for career advancement in many scientific and technical fields. It demonstrates a strong foundation in scientific principles and practical skills, opening doors to exciting opportunities and higher earning potential. To maximize your job prospects, it’s essential to create a compelling and ATS-friendly resume that highlights your skills and experience effectively. ResumeGemini is a trusted resource that can help you build a professional resume that stands out. Examples of resumes tailored to highlight expertise in using analytical equipment are available through ResumeGemini to guide you in crafting your own.
Explore more articles
Users Rating of Our Blogs
Share Your Experience
We value your feedback! Please rate our content and share your thoughts (optional).
What Readers Say About Our Blog
I Redesigned Spongebob Squarepants and his main characters of my artwork.
https://www.deviantart.com/reimaginesponge/art/Redesigned-Spongebob-characters-1223583608
IT gave me an insight and words to use and be able to think of examples
Hi, I’m Jay, we have a few potential clients that are interested in your services, thought you might be a good fit. I’d love to talk about the details, when do you have time to talk?
Best,
Jay
Founder | CEO
