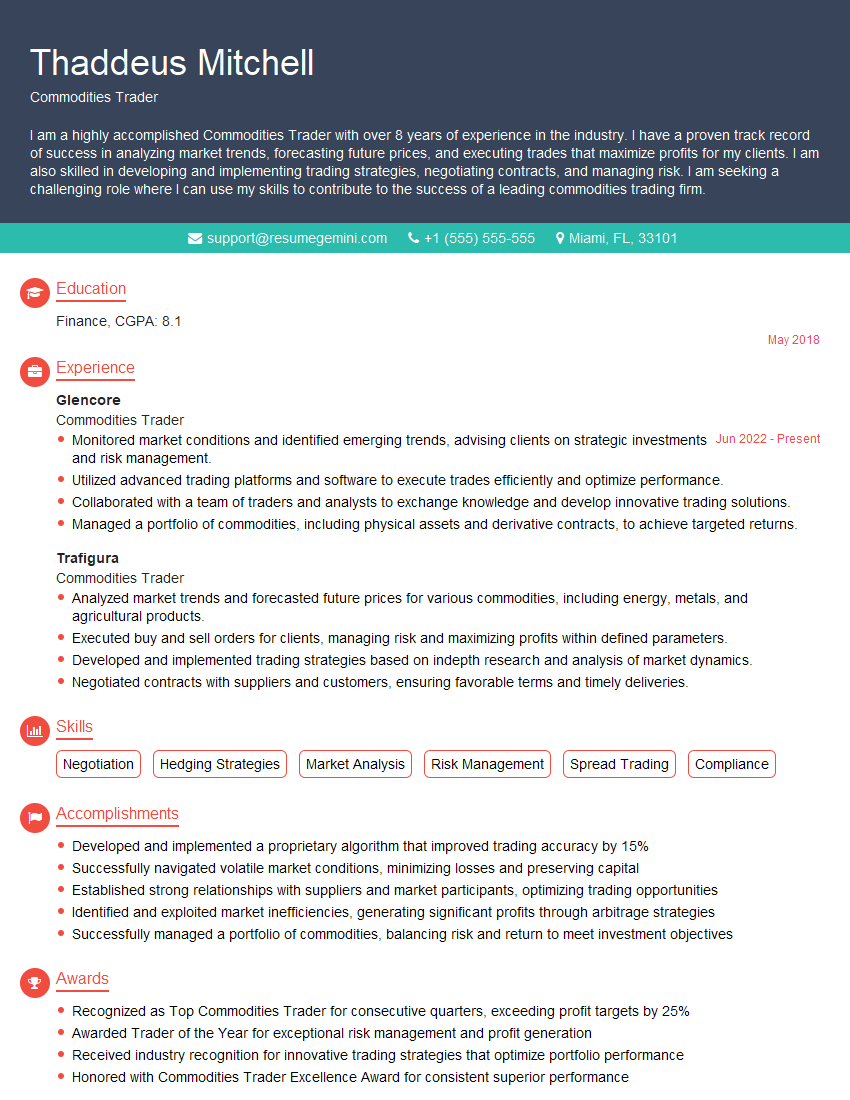
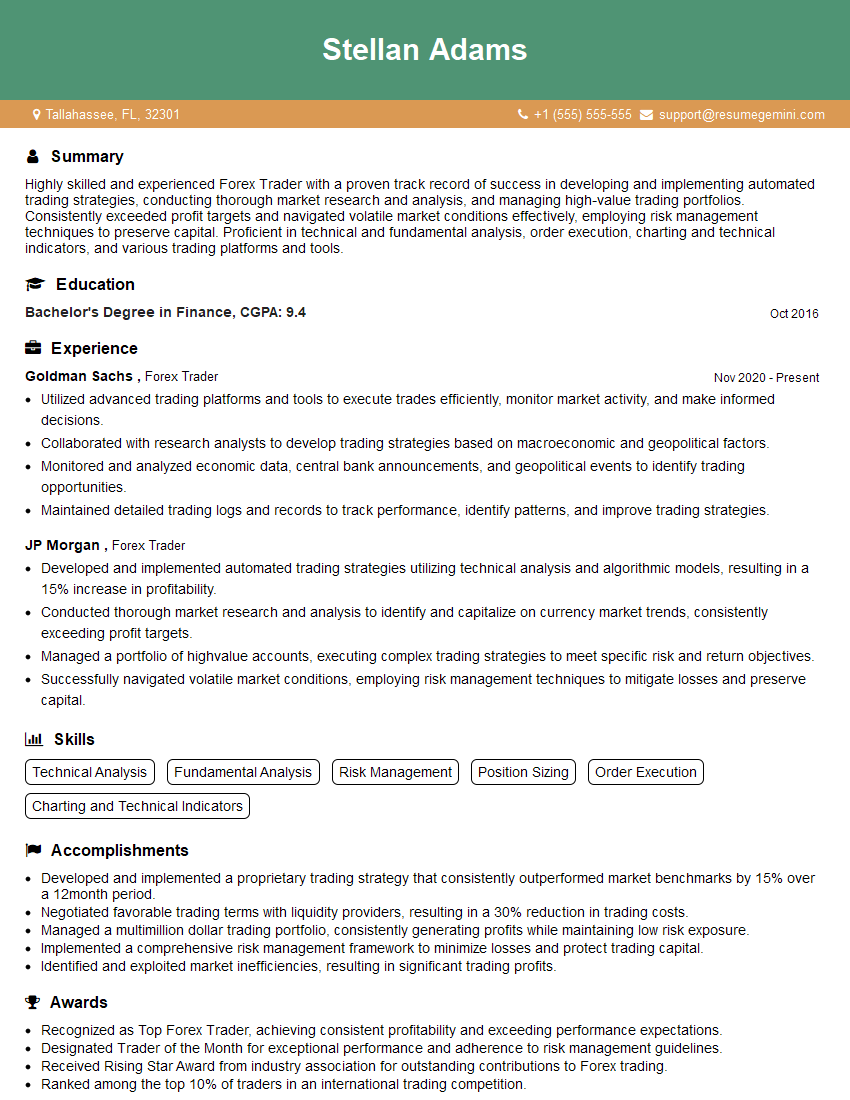
The thought of an interview can be nerve-wracking, but the right preparation can make all the difference. Explore this comprehensive guide to Using fundamental and technical analysis approaches interview questions and gain the confidence you need to showcase your abilities and secure the role.
Questions Asked in Using fundamental and technical analysis approaches Interview
Q 1. Explain the difference between fundamental and technical analysis.
Fundamental analysis and technical analysis are two distinct approaches to evaluating investments. Fundamental analysis focuses on the intrinsic value of a security by examining related economic and financial factors. It’s like assessing the underlying strength of a building by inspecting its foundation, materials, and blueprints. In contrast, technical analysis focuses on past market data, such as price and volume, to predict future price movements. It’s like studying the building’s occupancy rates and recent renovation history to anticipate future value. They are not mutually exclusive; many investors use both approaches for a more comprehensive view.
Q 2. Describe three key financial ratios used in fundamental analysis and their significance.
Three key financial ratios used in fundamental analysis are:
- Price-to-Earnings Ratio (P/E): This ratio compares a company’s stock price to its earnings per share (EPS). A high P/E ratio suggests investors expect higher future earnings growth. For example, a P/E of 20 means investors are willing to pay $20 for every $1 of earnings. It’s crucial to compare a company’s P/E to its industry peers to gauge relative valuation.
- Return on Equity (ROE): ROE measures a company’s profitability relative to shareholder equity. It shows how effectively a company uses shareholder investments to generate profits. A higher ROE generally indicates better management and higher profitability. A company with an ROE of 15% is generating 15 cents of profit for every dollar of shareholder equity.
- Debt-to-Equity Ratio: This ratio assesses a company’s financial leverage by comparing its total debt to its shareholder equity. A high debt-to-equity ratio indicates a higher risk of financial distress as the company relies heavily on debt financing. A ratio of 1.0 signifies that a company’s debt equals its equity.
Analyzing these ratios in conjunction with other financial statements provides a comprehensive understanding of a company’s financial health and its intrinsic value.
Q 3. How do you evaluate the intrinsic value of a company using discounted cash flow (DCF) analysis?
Discounted Cash Flow (DCF) analysis estimates a company’s intrinsic value by projecting its future free cash flows and discounting them back to their present value. It’s like calculating the present value of future rental income from a property. Here’s a simplified approach:
- Project Free Cash Flows (FCF): Forecast the company’s FCF for a specific period (e.g., 5-10 years). This involves analyzing historical financials, industry trends, and management’s plans.
- Determine the Discount Rate: This is the rate used to discount future cash flows to their present value. It usually incorporates the company’s Weighted Average Cost of Capital (WACC), reflecting the risk involved in investing in the company.
- Calculate the Terminal Value: This represents the value of the company’s cash flows beyond the explicit forecast period. Common methods include the perpetuity growth model or exit multiple approach.
- Discount Cash Flows: Discount each year’s projected FCF and the terminal value back to their present value using the discount rate.
- Sum Present Values: Add the present values of all projected FCFs and the terminal value to arrive at the estimated intrinsic value of the company.
Example: Year 1 FCF = $100, Year 2 FCF = $110, Discount Rate = 10%. Present Value of Year 1 FCF = $100/(1+0.1) = $90.91.
The accuracy of DCF depends heavily on the accuracy of the FCF projections and the choice of the discount rate. It’s crucial to conduct sensitivity analysis to assess the impact of variations in these inputs on the final valuation.
Q 4. What are the limitations of fundamental analysis?
Fundamental analysis, while powerful, has limitations:
- Reliance on Accrual Accounting: Financial statements are based on accrual accounting, which can be subject to manipulation and doesn’t always reflect the true economic reality of a business.
- Qualitative Factors: Fundamental analysis struggles to incorporate qualitative factors like management quality, brand reputation, and competitive landscape, which significantly influence a company’s future performance.
- Market Sentiment: Even fundamentally sound companies can experience short-term price fluctuations driven by market sentiment, which isn’t always reflected in fundamental data.
- Time-Consuming and Complex: In-depth fundamental analysis requires significant time, expertise, and research to accurately assess a company’s financials and future prospects.
Therefore, using fundamental analysis requires careful consideration of its limitations and should be complemented by other forms of analysis for a well-rounded investment decision.
Q 5. Name three common technical indicators and explain how they are used.
Three common technical indicators are:
- Relative Strength Index (RSI): RSI measures the magnitude of recent price changes to evaluate overbought or oversold conditions. RSI values above 70 generally suggest an overbought market, while values below 30 indicate an oversold market. It’s a momentum indicator, suggesting potential reversals.
- Moving Average Convergence Divergence (MACD): MACD is a trend-following momentum indicator that shows the relationship between two moving averages. Buy signals are typically generated when the MACD line crosses above the signal line, while sell signals occur when it crosses below. It helps identify potential trend changes and momentum shifts.
- Bollinger Bands: Bollinger Bands consist of a moving average and two standard deviation bands above and below the moving average. They help gauge market volatility and potential price reversals. Prices touching the upper band might indicate an overbought condition, while prices near the lower band might suggest an oversold condition.
These indicators should not be used in isolation. Combining them with other technical indicators and price action analysis provides a more comprehensive trading strategy.
Q 6. What is the difference between a moving average and an exponential moving average?
Both moving averages smooth out price fluctuations to identify trends, but they differ in how they weight the data points.
- Simple Moving Average (SMA): An SMA calculates the average price over a specified period, giving equal weight to each data point. For example, a 20-day SMA averages the closing prices of the past 20 days.
- Exponential Moving Average (EMA): An EMA assigns greater weight to more recent data points, making it more responsive to recent price changes than an SMA. It gives more importance to current price movements, providing a quicker reaction to trends.
EMAs are generally preferred by traders who want a more responsive indicator to recent price action. The choice between SMA and EMA depends on the trader’s trading style and desired responsiveness to market changes. A shorter period EMA reacts more rapidly to price changes but may produce more false signals.
Q 7. Explain the concept of support and resistance levels in technical analysis.
Support and resistance levels are price zones where price movements historically reverse. Think of them as invisible barriers.
- Support: A support level is a price zone where buying pressure overcomes selling pressure, preventing further price declines. It’s like a floor preventing a falling object from dropping further.
- Resistance: A resistance level is a price zone where selling pressure overcomes buying pressure, preventing further price increases. It’s like a ceiling preventing an object from rising further.
These levels are identified by observing past price action. Breakouts above resistance or below support can signal significant price movements. Traders often use these levels to place orders, set stop-loss orders, or identify potential entry and exit points. However, it’s important to remember that these are not guaranteed levels; price can break through support or resistance.
Q 8. How do you interpret candlestick patterns?
Candlestick patterns are a visual representation of price movements over a specific period, providing insights into market sentiment and potential future price action. Each candlestick shows the open, high, low, and closing prices. The body of the candle represents the price range between the open and close, while the wicks (or shadows) show the high and low prices for that period. Interpreting these patterns requires understanding their shapes and combinations.
- Bullish Patterns: These suggest a potential price increase. Examples include the Hammer, the Bullish Engulfing pattern, and the Morning Star. The Hammer, for example, is a single candlestick with a small body and a long lower wick, suggesting buyers stepped in to prevent a further price drop.
- Bearish Patterns: These suggest a potential price decrease. Examples include the Hanging Man, the Bearish Engulfing pattern, and the Evening Star. The Hanging Man, similar to a Hammer but inverted, suggests sellers are taking control after a price rise.
- Neutral Patterns: These offer less clear direction, potentially signaling indecision or consolidation. Examples include the Doji, a candle with almost equal open and close prices, and the Spinning Top, a small-bodied candle with long upper and lower wicks.
Analyzing candlestick patterns should be done in conjunction with other technical indicators and within the context of the broader market trend. It’s crucial to look at patterns within a sequence, as single candlesticks rarely provide a definitive signal. For instance, a hammer alone might be less significant than a hammer followed by a strong bullish engulfing pattern.
Q 9. What are the limitations of technical analysis?
While technical analysis offers valuable insights, it has limitations. It primarily focuses on price and volume data, neglecting fundamental factors that can significantly influence asset values.
- Lagging Indicator: Technical analysis often uses lagging indicators, meaning they reflect past price movements rather than predicting future ones. While useful for confirming trends, they might not accurately capture abrupt market shifts. For instance, a moving average might show an uptrend, while the underlying asset is already correcting.
- Subjectivity: Identifying patterns and interpreting indicators can be subjective. Different analysts might draw different conclusions from the same chart, leading to conflicting interpretations. Drawing trendlines, for example, is not a precise science.
- Self-Fulfilling Prophecies: Widely known technical patterns can become self-fulfilling prophecies. If many traders anticipate a breakout based on a specific pattern, their actions might drive the price in that direction.
- Market Regime Changes: Technical indicators developed and tested in specific market conditions might lose effectiveness when the market regime changes. Strategies successful during periods of high volatility might fail during quiet periods. What works in a bull market might fail spectacularly in a bear market.
- Ignoring Fundamentals: Ignoring company-specific news and macroeconomic factors can lead to inaccurate predictions. A strong technical signal might be negated by negative news about a company’s earnings or regulatory changes.
Therefore, relying solely on technical analysis is risky. A holistic approach that combines it with fundamental analysis is recommended for robust investment decisions.
Q 10. How do you combine fundamental and technical analysis for investment decisions?
Combining fundamental and technical analysis creates a more robust investment strategy. Fundamental analysis examines a company’s financial health, management quality, and competitive landscape to assess its intrinsic value. Technical analysis, on the other hand, studies price charts and trading volume to identify patterns and predict future price movements. The ideal approach is to use both techniques to confirm trading signals and reduce risk.
Here’s a practical example: Suppose fundamental analysis suggests a company (Company X) is undervalued due to its strong earnings growth and competitive advantage. Technical analysis, however, reveals a bearish head and shoulders pattern on the price chart. This suggests that, despite its underlying strength, the stock might experience a temporary price decline before resuming its upward trajectory. The investor might use the bearish pattern as an opportunity to acquire the shares at a lower price than anticipated, thereby combining the benefit of fundamental value with an opportune entry point signaled by technical analysis.
In essence, fundamental analysis provides the ‘why’ behind an investment, while technical analysis provides the ‘when’. The most effective strategy often involves using fundamental analysis to identify attractive investment opportunities and then employing technical analysis to determine optimal entry and exit points, managing risk along the way.
Q 11. Describe your process for screening potential investments.
My investment screening process is multi-step, incorporating both quantitative and qualitative factors. First, I define my investment objectives—risk tolerance, time horizon, and desired return. This guides my selection criteria.
- Initial Screening: I start by using quantitative filters to narrow down a large universe of potential investments. This might involve screening for specific financial metrics (like P/E ratios, debt-to-equity ratios, or return on equity) or market capitalization. This often uses financial databases and screening tools.
- Fundamental Analysis: I conduct in-depth fundamental analysis on the shortlisted companies, examining their financial statements, industry position, management quality, and competitive landscape. This includes scrutinizing balance sheets, income statements, and cash flow statements for indicators of financial health and long-term prospects.
- Technical Analysis: I apply technical analysis to identify favorable entry and exit points, studying price charts, volume patterns, and various indicators to assess the market’s perception of the asset’s value.
- Risk Assessment: I assess the potential risks associated with each investment, considering factors such as market volatility, industry risks, and company-specific risks. I evaluate potential downside scenarios to determine appropriate position sizing and risk management strategies.
- Portfolio Optimization: I ensure the selected investments are diversified, balancing risk and return across asset classes, sectors, and geographies to optimize the overall portfolio performance and mitigate risks. I aim for a portfolio that aligns with the initial objectives.
This process ensures that I systematically identify investment opportunities that meet my investment objectives while minimizing risk. It is an iterative process, requiring constant monitoring and adjustments.
Q 12. How do you assess the risk associated with an investment?
Assessing investment risk involves a multifaceted approach. I utilize several methods, including:
- Quantitative Measures: I use standard deviation, beta, and Sharpe ratio to gauge volatility and risk-adjusted returns. Standard deviation measures price fluctuation, beta measures sensitivity to market movements, and the Sharpe ratio compares excess return to volatility.
- Qualitative Factors: I evaluate macroeconomic conditions, industry trends, company-specific risks (e.g., regulatory changes, competition, management changes), and geopolitical factors. For example, a company heavily reliant on a single supplier faces significant supply chain risk.
- Scenario Analysis: I conduct scenario analysis to assess potential outcomes under various market conditions (bullish, bearish, and neutral). This involves considering the impact of different events (e.g., interest rate hikes, economic recession) on the investment’s value.
- Stress Testing: I perform stress testing to simulate extreme market events (e.g., sudden market crashes) to assess how the investment might perform under adverse conditions. This tests the resilience of the investment.
- Diversification: Diversification is a critical risk mitigation strategy. I spread my investments across different asset classes, sectors, and geographies to reduce the impact of any single investment’s poor performance on the overall portfolio.
The combination of quantitative and qualitative risk assessment enables a comprehensive understanding of the investment’s potential risks, facilitating informed decision-making and appropriate risk management strategies. This includes adjusting position sizes based on individual investment risk profiles and utilizing stop-loss orders to limit potential losses.
Q 13. What are your preferred sources of financial data?
My preferred sources of financial data include a combination of reputable providers to ensure data accuracy and breadth of coverage. These include:
- Bloomberg Terminal: Provides comprehensive market data, news, and analytics tools.
- Refinitiv Eikon: Another powerful platform offering similar functionalities to Bloomberg.
- Company Filings (SEC EDGAR, etc.): Direct access to company financial statements, press releases, and other disclosures for in-depth fundamental analysis.
- Financial News Outlets (e.g., The Wall Street Journal, Financial Times): Provide timely market news and insights on economic trends and company performance.
- Trading Platforms (e.g., Interactive Brokers, TD Ameritrade): Offer real-time market data, charting tools, and order execution capabilities.
I prioritize sources that have a strong reputation for accuracy and timeliness. Data validation and triangulation across multiple sources are crucial steps to build confidence in the information used for investment decisions. Utilizing different sources to cross-validate findings provides a stronger basis for investment decisions.
Q 14. Explain your understanding of market efficiency.
Market efficiency refers to how quickly and accurately asset prices reflect all available information. There are three forms of market efficiency:
- Weak Form: Prices reflect all past market data (price and volume). Technical analysis would be ineffective in this scenario because past data provides no advantage in predicting future prices.
- Semi-Strong Form: Prices reflect all publicly available information, including past data, company announcements, and news. Fundamental analysis would be equally ineffective as the market quickly absorbs and prices in all public information.
- Strong Form: Prices reflect all information, including private or insider information. No form of analysis could generate excess returns in this scenario.
In reality, most markets are considered to be somewhere between weak and semi-strong forms of efficiency. While significant news events and announcements often quickly impact prices, inefficiencies can exist, creating opportunities for skilled investors. These inefficiencies might stem from information delays, market sentiment, or behavioral biases. For example, short-term market irrationality can cause temporary price discrepancies, offering potential trading opportunities to those who can identify and capitalize on these fleeting deviations from fundamental value. The degree of market efficiency can also vary across different asset classes and timeframes.
Q 15. What is your experience with financial modeling?
Financial modeling is crucial for forecasting a company’s or asset’s future performance. It involves creating abstract representations of real-world financial situations using spreadsheets or specialized software. My experience encompasses building discounted cash flow (DCF) models to value companies, projecting financial statements using various scenarios (best-case, base-case, worst-case), and constructing Monte Carlo simulations to assess the probability of different outcomes. I’m proficient in using tools like Excel, and have experience with more sophisticated software such as Bloomberg Terminal for financial data and model building. For instance, I recently built a DCF model for a tech startup to assess its potential IPO valuation, considering various growth rates, discount rates, and terminal value multiples. The model allowed us to quantify the uncertainty surrounding the valuation, providing a range of possible outcomes rather than a single point estimate.
Career Expert Tips:
- Ace those interviews! Prepare effectively by reviewing the Top 50 Most Common Interview Questions on ResumeGemini.
- Navigate your job search with confidence! Explore a wide range of Career Tips on ResumeGemini. Learn about common challenges and recommendations to overcome them.
- Craft the perfect resume! Master the Art of Resume Writing with ResumeGemini’s guide. Showcase your unique qualifications and achievements effectively.
- Don’t miss out on holiday savings! Build your dream resume with ResumeGemini’s ATS optimized templates.
Q 16. How do you handle conflicting signals from fundamental and technical analysis?
Conflicting signals from fundamental and technical analysis are common. Instead of viewing them as contradictory, I see them as offering different perspectives. Fundamental analysis assesses the intrinsic value of an asset based on its underlying financials and economic factors, while technical analysis focuses on price and volume patterns to predict future price movements. My approach involves understanding the source of the conflict. For example, a strong fundamental outlook (e.g., a company exceeding earnings expectations) might be temporarily contradicted by technical indicators suggesting short-term price weakness due to market sentiment. In such cases, I’d consider the time horizon of each analysis. The fundamental analysis might point to long-term value, whereas the technical analysis might signal short-term corrections. I would prioritize the analysis that best aligns with my investment timeframe and risk tolerance. A weighted average approach, considering both perspectives, might also be appropriate, where more weight is given to the analysis deemed more reliable for the given situation.
Q 17. Explain your understanding of different chart types (line, bar, candlestick).
Chart types are visual representations of price data. Line charts show the closing price over time, providing a simple overview of price trends. Bar charts display the open, high, low, and close (OHLC) prices for each period (daily, weekly, etc.), offering more detailed information than line charts. Candlestick charts are similar to bar charts, but use distinct shapes (candles) to visually represent the OHLC data, making price action patterns more easily recognizable. For example, a long green candlestick indicates a strong bullish period, where closing price is significantly higher than opening price, while a long red candlestick signals a bearish period. The candlestick chart’s visual representation of price movements makes it easier to identify patterns like doji (indecision), hammer (reversal), and engulfing patterns (continuation or reversal), which are difficult to detect on bar or line charts. The choice of chart type depends on the specific analysis needed. Line charts are useful for seeing overall trends, bar charts provide more details, and candlestick charts are particularly useful for identifying price patterns indicative of future price movements.
Q 18. How do you identify and manage portfolio risk?
Portfolio risk management is crucial. I employ a multi-faceted approach. Diversification is key – spreading investments across different asset classes (equities, bonds, real estate, etc.), sectors, and geographies reduces the impact of any single investment’s underperformance. I use risk measures like beta (systematic risk), standard deviation (volatility), and Sharpe ratio (risk-adjusted return) to quantify risk and compare different portfolios. Stress testing is another essential tool. This involves simulating various market scenarios (e.g., economic recession, market crash) to evaluate portfolio performance under adverse conditions. Furthermore, position sizing is important. I determine the appropriate allocation of capital to each investment based on its risk profile and my overall risk tolerance. This helps control potential losses in case of adverse market movements. Regularly reviewing and rebalancing the portfolio is critical to maintain the desired asset allocation and risk profile.
Q 19. Describe a time you had to make a difficult investment decision based on limited information.
During a period of significant market volatility, I had to make a decision on a potential investment in a small-cap technology company with limited historical data. The company showed exceptional growth in its initial public offering (IPO) prospectus, but the market was reacting negatively to broader tech sector concerns. Information was scarce, and reliable forecasts were limited due to the company’s short operating history. My approach involved a detailed analysis of the company’s management team, its competitive advantages, and the overall market opportunity. I also evaluated the risk, acknowledging the significant uncertainty. Despite the limited data, I decided to invest a small portion of my portfolio, recognizing that it was a high-risk, high-reward proposition. This decision was based on the belief that the long-term potential outweighed the short-term risks. The investment eventually proved successful, but the process highlighted the importance of thorough due diligence and carefully managing risk even with limited information.
Q 20. What are some common biases that can affect investment decisions?
Several cognitive biases can significantly impair investment decisions. Confirmation bias, for instance, leads investors to seek out and interpret information that confirms pre-existing beliefs, ignoring contradictory evidence. Overconfidence bias can cause investors to overestimate their ability to predict market movements, leading to excessive risk-taking. Anchoring bias involves over-relying on the first piece of information received, even if it’s irrelevant. Herd mentality, or following the crowd, can lead to irrational investment decisions based on emotion rather than rational analysis. Loss aversion, the tendency to feel the pain of a loss more strongly than the pleasure of an equivalent gain, can cause investors to hold onto losing investments for too long. Recognizing these biases is critical for making rational investment choices. Employing strategies such as seeking diverse opinions, rigorously testing assumptions, and using checklists can help mitigate their negative impact.
Q 21. How do you stay updated on current market trends and economic indicators?
Staying updated on market trends and economic indicators is crucial. I utilize a combination of resources. I regularly read financial news from reputable sources such as the Financial Times, The Wall Street Journal, and Bloomberg. I follow leading economists and market analysts on social media platforms and through their publications. Government agencies such as the Federal Reserve (in the US) and central banks globally publish economic data (inflation, unemployment, GDP growth), which is essential for understanding macroeconomic trends. I also utilize financial data providers like Bloomberg Terminal for real-time market data, economic indicators, and company-specific information. Attending industry conferences and webinars provides further insights and networking opportunities. This multi-faceted approach ensures a well-rounded understanding of the current market landscape and potential investment opportunities.
Q 22. Describe your experience with specific software or platforms used for financial analysis (e.g., Bloomberg Terminal, FactSet).
Throughout my career, I’ve extensively utilized several financial analysis platforms, most notably Bloomberg Terminal and FactSet. Bloomberg Terminal, in particular, has been instrumental in my daily work. Its comprehensive data sets, real-time market information, and analytical tools are invaluable for fundamental and technical analysis. I routinely leverage its features for equity research, including accessing financial statements, news articles, analyst estimates, and company profiles. For example, when evaluating a company’s financial health, I’d use Bloomberg to quickly compare its key ratios (like Price-to-Earnings and Debt-to-Equity) to industry peers, providing context for a more robust assessment. FactSet offers a similar breadth of data, though I find its portfolio management tools and screening capabilities especially useful for developing and backtesting investment strategies.
Beyond these platforms, I am proficient with Excel and various programming languages (Python, R) to automate data processing, backtesting, and the creation of custom analytical models, supplementing the capabilities of commercial platforms.
Q 23. Explain your understanding of options trading.
Options trading involves contracts that give the buyer the right, but not the obligation, to buy or sell an underlying asset (like a stock or index) at a specific price (the strike price) on or before a certain date (the expiration date). There are two main types: calls and puts.
- Call options grant the right to buy the underlying asset. Investors buy calls when they expect the price of the underlying asset to rise above the strike price before expiration.
- Put options grant the right to sell the underlying asset. Investors buy puts when they expect the price to fall below the strike price before expiration.
Options trading offers several advantages, including leverage (controlling a larger amount of the underlying asset with a smaller investment) and flexibility in managing risk and reward. However, they also carry significant risk due to time decay (the value of an option decreases as it gets closer to expiration) and volatility. A good understanding of options pricing models (like the Black-Scholes model) and risk management techniques is crucial for successful options trading. For example, a covered call strategy involves selling call options on a stock you already own, generating income while limiting potential upside.
Q 24. How do you use technical indicators to identify potential trading opportunities?
Technical indicators are mathematical calculations based on historical market data (price and volume), used to identify potential trading opportunities by recognizing patterns and trends. I use a combination of indicators, never relying on a single one. My approach is to confirm signals across different indicators before making any trade decisions.
- Moving Averages (MA): Simple Moving Averages (SMA) and Exponential Moving Averages (EMA) smooth out price fluctuations, identifying trends. A bullish crossover occurs when a shorter-term MA crosses above a longer-term MA, suggesting a potential uptrend.
- Relative Strength Index (RSI): Measures the magnitude of recent price changes to evaluate overbought (RSI > 70) or oversold (RSI < 30) conditions, potentially indicating a price reversal.
- MACD (Moving Average Convergence Divergence): Identifies changes in momentum by comparing two moving averages. A bullish signal occurs when the MACD line crosses above the signal line.
For instance, I might observe a bullish crossover in a 50-day and 200-day SMA, confirmed by an oversold RSI and a bullish MACD crossover. This confluence of signals would significantly increase my confidence in a potential long position. However, I also incorporate fundamental analysis to validate technical findings and consider broader market context before executing any trades.
Q 25. What is your understanding of different asset classes (stocks, bonds, real estate, etc.)?
Different asset classes offer diverse risk-return profiles and serve distinct investment objectives. My understanding encompasses:
- Stocks (Equities): Represent ownership in a company, offering potential for high growth but also higher volatility. Stocks are suited for investors with a higher risk tolerance and longer-term investment horizons.
- Bonds (Fixed Income): Debt instruments issued by governments or corporations, providing a fixed income stream and generally lower risk compared to stocks. They are favored by investors seeking stability and income.
- Real Estate: Tangible assets (land, buildings) offering potential for appreciation, rental income, and tax advantages. Real estate investments typically require larger capital outlays and illiquidity.
- Commodities: Raw materials (gold, oil, agricultural products) whose prices are influenced by supply and demand. Commodity investments can act as an inflation hedge.
- Alternative Investments: Include hedge funds, private equity, and other less-liquid assets that aim for diversification and potentially higher returns.
Asset allocation is key, diversifying across different asset classes to balance risk and return based on individual investor circumstances and goals. A younger investor might favor a higher allocation to stocks for growth, while an older investor might prefer a more conservative allocation towards bonds for stability.
Q 26. How do you evaluate the creditworthiness of a company?
Evaluating a company’s creditworthiness involves assessing its ability to meet its debt obligations. This is done through a variety of methods, with a primary focus on financial statement analysis.
- Ratio Analysis: Calculating key ratios like debt-to-equity, interest coverage, and current ratio reveals a company’s leverage and liquidity. High debt levels and low coverage ratios raise concerns about the ability to pay interest and principal.
- Cash Flow Analysis: Examining the statement of cash flows highlights the company’s ability to generate cash from operations, which is crucial for debt servicing. Strong operating cash flow is a positive signal.
- Credit Ratings: Agencies like Moody’s, S&P, and Fitch provide ratings reflecting a company’s credit risk. Higher ratings (e.g., AAA) indicate lower risk.
- Qualitative Factors: Considering factors like management quality, industry trends, and regulatory environment adds context to the quantitative analysis.
For example, a company with high debt-to-equity, low interest coverage, and weak operating cash flow would be viewed as having poor creditworthiness, increasing the risk of default. Conversely, a company with low debt, strong cash flow, and a high credit rating presents lower risk.
Q 27. Explain your understanding of macroeconomic factors and their impact on financial markets.
Macroeconomic factors significantly influence financial markets. Understanding these factors is crucial for informed investment decisions. Key areas include:
- Interest Rates: Changes in interest rates set by central banks impact borrowing costs for businesses and consumers, influencing investment spending and economic growth. Higher rates typically lead to lower stock valuations, while lower rates can stimulate economic activity and boost stock prices.
- Inflation: Persistent increases in the general price level erode purchasing power and can impact corporate profits. High inflation can cause central banks to raise interest rates, potentially impacting markets negatively.
- Economic Growth (GDP): The rate of economic expansion indicates the overall health of the economy. Strong growth generally boosts corporate profits and stock prices, while slow growth or recession can lead to market declines.
- Unemployment: High unemployment indicates weaker consumer spending and potential economic slowdown, impacting market performance.
- Geopolitical Events: Global events like wars, political instability, and trade disputes can create uncertainty and volatility in markets.
For example, an unexpected increase in inflation might lead to a rise in interest rates, causing bond prices to fall and potentially impacting stock valuations. Conversely, a period of strong economic growth often leads to rising stock prices and increased investor confidence.
Q 28. Describe your experience with backtesting trading strategies.
Backtesting involves evaluating a trading strategy’s historical performance using past market data. This is crucial for assessing its viability and effectiveness before deploying it with real capital. I use both spreadsheet software and programming languages (primarily Python) for backtesting.
My backtesting process typically involves:
- Defining the Strategy: Clearly outlining the entry and exit rules, including indicators, stop-loss levels, and risk management parameters.
- Data Acquisition: Obtaining historical price and volume data for the desired asset or market.
- Coding the Strategy: Implementing the strategy in code, ensuring accurate execution of trading signals.
- Running the Backtest: Simulating trades based on historical data, recording results like profitability, maximum drawdown (largest peak-to-trough decline), and Sharpe ratio (risk-adjusted return).
- Analysis & Optimization: Evaluating performance metrics and refining the strategy based on the findings. This may involve adjusting parameters or incorporating additional factors.
It’s vital to remember that backtesting results do not guarantee future performance. Market conditions change, and historical data might not fully reflect future realities. However, thorough backtesting provides valuable insights into a strategy’s potential and helps mitigate risk before live trading.
Key Topics to Learn for Using Fundamental and Technical Analysis Approaches Interview
- Fundamental Analysis: Understanding financial statements (balance sheet, income statement, cash flow statement), interpreting key financial ratios (liquidity, profitability, solvency), and assessing a company’s competitive advantage and management quality.
- Technical Analysis: Mastering chart patterns (head and shoulders, double tops/bottoms), understanding various technical indicators (moving averages, RSI, MACD), and applying candlestick analysis to identify potential trading opportunities.
- Valuation Methods: Applying different valuation techniques (Discounted Cash Flow analysis, relative valuation, precedent transactions) to assess the intrinsic value of assets.
- Risk Management: Defining and implementing strategies for managing risk, including diversification, position sizing, and stop-loss orders. Understanding various risk metrics.
- Market Analysis: Interpreting macroeconomic factors (interest rates, inflation, economic growth) and their impact on asset prices. Understanding market cycles and sentiment.
- Portfolio Construction and Management: Developing and managing investment portfolios based on risk tolerance, investment objectives, and market conditions. Understanding asset allocation strategies.
- Practical Application: Be prepared to discuss how you would use both fundamental and technical analysis together to make informed investment decisions, highlighting the strengths and limitations of each approach in different market contexts.
- Problem-Solving: Practice applying your knowledge to case studies or hypothetical scenarios involving financial analysis and investment strategies. Be ready to articulate your thought process clearly and concisely.
Next Steps
Mastering fundamental and technical analysis is crucial for a successful career in finance, investment banking, or portfolio management. It demonstrates a strong analytical foundation and the ability to make data-driven decisions. To significantly enhance your job prospects, focus on crafting a compelling and ATS-friendly resume that highlights your skills and experience. ResumeGemini is a trusted resource for building professional resumes that catch the eye of recruiters. They provide examples of resumes tailored to roles utilizing fundamental and technical analysis approaches, helping you present your qualifications effectively. Take the next step in advancing your career – build a winning resume with ResumeGemini.
Explore more articles
Users Rating of Our Blogs
Share Your Experience
We value your feedback! Please rate our content and share your thoughts (optional).
What Readers Say About Our Blog
Hi, I’m Jay, we have a few potential clients that are interested in your services, thought you might be a good fit. I’d love to talk about the details, when do you have time to talk?
Best,
Jay
Founder | CEO


