Every successful interview starts with knowing what to expect. In this blog, we’ll take you through the top Cloud Monitoring interview questions, breaking them down with expert tips to help you deliver impactful answers. Step into your next interview fully prepared and ready to succeed.
Questions Asked in Cloud Monitoring Interview
Q 1. Explain the difference between monitoring and observability.
Monitoring and observability are closely related but distinct concepts. Think of it like this: monitoring is like checking your car’s dashboard – you see the speed, fuel level, and engine temperature. It provides a reactive view, alerting you when something is outside predefined thresholds. Observability, on the other hand, is like having a mechanic’s diagnostic tool – it allows you to understand the why behind the dashboard readings. It’s a proactive approach, providing deep insights into the system’s behavior even when you don’t know what to look for specifically.
In simpler terms, monitoring answers ‘what is happening?’ while observability answers ‘why is it happening?’. Monitoring typically relies on predefined metrics and alerts, whereas observability uses tracing, logging, and metrics to understand the overall system behavior. A robust system needs both.
Q 2. What are the key components of a robust cloud monitoring system?
A robust cloud monitoring system comprises several key components:
- Data Collection Agents: These agents reside on your servers and collect metrics, logs, and traces. They act as the eyes and ears of your monitoring system.
- Centralized Backend: This is the brain of the operation, storing and processing all the collected data. It often involves a time-series database for efficient metric storage and retrieval.
- Alerting and Notification System: This system triggers alerts when predefined thresholds are breached, notifying the appropriate teams via email, SMS, or other channels. A well-designed system prioritizes alerts based on severity and impact.
- Visualization and Dashboarding: This allows you to visually represent the collected data through customizable dashboards, providing at-a-glance insights into the system’s health and performance.
- Log Management and Analysis: This component provides the ability to collect, store, search, and analyze logs from various sources, facilitating troubleshooting and debugging.
- Automated Remediation: Ideally, the system should be capable of automating some responses to alerts, such as scaling resources or restarting failing services.
The interplay between these components is crucial. For instance, data from collection agents feeds into the backend, which then uses this data to generate alerts via the notification system, all while being visualized on dashboards. This integrated approach provides a complete and powerful monitoring solution.
Q 3. Describe your experience with various monitoring tools (e.g., Prometheus, Grafana, Datadog, CloudWatch).
I have extensive experience with various monitoring tools, including Prometheus, Grafana, Datadog, and CloudWatch.
- Prometheus is an open-source monitoring system that excels at pulling metrics from applications and servers using its own client libraries. I’ve used it extensively for building highly scalable and reliable monitoring solutions for microservices architectures. It’s particularly strong in its ability to perform complex queries on time-series data.
- Grafana is a popular open-source dashboarding tool. I’ve used it to create insightful visualizations of data from various sources, including Prometheus, other time-series databases, and logs. Its flexibility in creating custom dashboards is highly valuable.
- Datadog is a comprehensive SaaS monitoring platform providing unified infrastructure, application, and log monitoring. I’ve utilized Datadog in several projects, appreciating its ease of use and the rich features it provides out of the box. It simplifies the complexities of setting up and managing a complete monitoring pipeline.
- CloudWatch is Amazon’s native monitoring service. I’ve leveraged it extensively for monitoring AWS resources and applications running on AWS. Its seamless integration with other AWS services and its robust alerting system is a significant advantage.
My experience with these tools allows me to select the right tool for the specific needs of a project, often integrating them for a more robust solution. For example, I’ve used Prometheus for metric collection, Grafana for dashboarding, and Datadog for alerting and centralized management.
Q 4. How do you handle alerts and prioritize incidents in a cloud environment?
Handling alerts and prioritizing incidents involves a structured approach. First, I establish clear alert thresholds based on the specific system and application needs. For example, CPU utilization above 90% might trigger an alert, but not at 80%.
Next, I prioritize incidents using a combination of factors including:
- Severity: Critical alerts, such as application outages, take precedence over minor issues like disk space warnings.
- Impact: The number of users affected and the business impact of the issue are key considerations.
- Frequency: Frequent alerts from the same source may indicate a deeper underlying problem requiring more immediate attention.
I often employ an escalation process, where alerts are initially routed to on-call engineers. If the issue remains unresolved after a certain time, the alert escalates to senior engineers or management. Utilizing automated runbooks can significantly reduce the time to resolution. For example, if a database replication lag is detected, a runbook could automatically restart the replication process.
Q 5. Explain different types of cloud monitoring metrics (e.g., CPU utilization, memory usage, network latency).
Cloud monitoring metrics are quantifiable measurements of system performance. They can be broadly categorized as follows:
- Resource Utilization Metrics: These track the consumption of resources like CPU, memory, disk I/O, and network bandwidth. For example,
CPUUtilization,MemoryUsed,DiskReadBytes,NetworkBytesSent. - Application Performance Metrics: These metrics focus on how well the application performs, including response times, error rates, request latency, and throughput. Example metrics:
RequestLatency,ErrorRate,TransactionsPerSecond. - Network Metrics: These metrics provide insights into network performance. Key examples include
NetworkLatency,PacketLoss,BandwidthUtilization. - Log Metrics: While logs themselves are not metrics, they are often processed to extract aggregate statistics that can be visualized as metrics. For example, the number of error logs per minute.
Choosing the right metrics depends on the specific monitoring goals. For example, a web application might focus on response times and error rates, while an infrastructure team might concentrate on CPU utilization and network latency.
Q 6. How do you ensure the scalability and reliability of your monitoring system?
Ensuring the scalability and reliability of a monitoring system requires careful planning and design. Here’s how:
- Horizontal Scaling: The system should be designed to scale horizontally by adding more monitoring agents and backend servers as needed. This ensures the system can handle increased data volume without performance degradation.
- Decentralized Architecture: Distributing the collection and processing of data across multiple regions helps to prevent single points of failure and improves resilience. Employing geographically distributed agents ensures consistent data collection even with outages in specific regions.
- Efficient Data Storage: Using a time-series database optimized for high-volume data ingestion and retrieval is crucial. These databases are engineered to handle the specific demands of monitoring data, enabling efficient querying and reporting.
- Redundancy and High Availability: Implementing redundant systems for all critical components prevents outages. This includes using load balancers, database replication, and multiple monitoring agents.
- Automated Scaling: Auto-scaling capabilities allow the system to dynamically adjust resources based on current load. This ensures optimal performance and prevents resource bottlenecks.
Regular testing and capacity planning are vital for validating the system’s scalability and preventing unexpected outages under increased load. Performance testing and disaster recovery drills ensure the system can withstand planned and unplanned disruptions.
Q 7. Describe your experience with log management and analysis tools.
My experience with log management and analysis tools is extensive. I’ve worked with both centralized logging solutions like Elasticsearch, Logstash, and Kibana (ELK stack) and cloud-native solutions like CloudWatch Logs and Datadog Logs.
The ELK stack is an open-source solution that provides powerful capabilities for log collection, processing, and visualization. I’ve used it for building comprehensive log management systems for large-scale applications, enabling efficient log searching, filtering, and analysis.
CloudWatch Logs and Datadog Logs offer similar functionalities but with tighter integration with their respective platforms. CloudWatch Logs integrates seamlessly with other AWS services, while Datadog Logs offers advanced features like anomaly detection and log correlation.
My approach involves using log analysis to correlate events across different systems and applications, identify root causes of failures, and improve system performance. I use regular expressions and advanced query languages (like those in Elasticsearch) to filter and analyze log data effectively. Furthermore, I leverage log aggregation to consolidate logs from various sources for centralized monitoring and analysis.
Q 8. How do you troubleshoot performance issues using monitoring data?
Troubleshooting performance issues using monitoring data is like being a detective. You start with clues (metrics and logs) and piece together the story to identify the root cause. It begins with identifying the symptoms: Is the application slow? Are error rates high? Then, we use monitoring data to investigate.
Identify affected components: Monitoring tools help pinpoint which services or infrastructure components are experiencing problems. For example, high CPU utilization on a specific server could indicate a bottleneck.
Analyze metrics: Examine relevant metrics such as CPU usage, memory consumption, network latency, disk I/O, and request response times. Look for anomalies or trends that correlate with the observed performance issues. For instance, a sudden spike in database query latency might point to a database problem.
Correlate with logs: Combine metric analysis with log analysis. Error messages or warning logs can provide valuable context about the nature of the problem. If you see high error rates alongside slow response times, it suggests a potential code-level issue.
Isolate the root cause: By systematically investigating metrics and logs, you can trace the problem’s origin. This often involves drilling down from high-level metrics to more granular details. For example, analyzing individual application logs can help pinpoint the exact lines of code causing slowdowns.
Implement solutions and monitor impact: Once you’ve identified the root cause, implement the appropriate fix (e.g., scaling up resources, code optimization, database tuning). Then, continuously monitor the system to ensure the solution resolves the issue and doesn’t introduce new problems.
For example, I once diagnosed a performance bottleneck in an e-commerce website by correlating high CPU usage on the application servers with slow response times during peak hours. Log analysis revealed a specific API call that was poorly optimized, causing significant delays. After optimizing this API, the performance issue was resolved.
Q 9. Explain your experience with setting up and managing dashboards.
Dashboard creation and management are crucial for effective monitoring. I have extensive experience creating dashboards using various tools such as Grafana, Datadog, and CloudWatch. My approach emphasizes clarity, efficiency, and actionability.
Targeted audiences: I tailor dashboards to different audiences – developers, operations teams, and management – ensuring each dashboard provides the relevant information in a digestible format.
Key performance indicators (KPIs): I focus on selecting and visualizing the most critical KPIs, filtering out unnecessary noise. This prevents alert fatigue and ensures quick identification of potential problems.
Visualizations: I use a variety of visualizations, such as charts, graphs, tables, and maps, to effectively communicate data. I leverage color-coding and threshold settings to highlight critical alerts.
Interactive elements: Dashboards incorporate interactive elements such as drill-down capabilities, allowing users to investigate metrics at greater depth.
Automation: I automate dashboard creation and updates where possible to reduce manual effort and ensure accuracy.
Version control and collaboration: I use version control systems to manage changes to dashboards, facilitating collaboration among team members and tracking modifications over time.
For instance, for a large-scale application, I created a series of dashboards, each focusing on a specific aspect of the system (e.g., application performance, database health, network traffic). These dashboards included customizable views and automated alerts, enabling rapid identification and resolution of problems.
Q 10. How do you use monitoring data to inform capacity planning decisions?
Capacity planning utilizes monitoring data to predict future resource needs and prevent performance degradation. It’s a proactive approach, not reactive.
Historical trend analysis: We analyze historical monitoring data (CPU, memory, network, disk I/O) to identify usage patterns and growth trends.
Forecasting: Based on historical trends and projected growth, we forecast future resource requirements. Techniques like linear regression or exponential smoothing can be used to predict resource usage.
Stress testing and simulations: Conduct stress tests or simulations to assess the system’s capacity under peak loads or during anticipated events.
Resource optimization: Identify opportunities to optimize resource utilization. This might involve improving application efficiency, optimizing database queries, or consolidating resources.
Right-sizing resources: Adjust resources (compute, memory, storage, network bandwidth) based on capacity planning analysis. Avoid over-provisioning resources, as it wastes cost.
In one project, analyzing historical data showed a consistent increase in database traffic during holiday seasons. We used this data to forecast capacity needs for the upcoming holiday season, allowing us to proactively scale up database resources and prevent performance issues.
Q 11. Describe your experience with different types of monitoring (e.g., application, infrastructure, network).
I possess experience across various monitoring types:
Application Monitoring: This involves monitoring application performance metrics such as response times, error rates, transaction throughput, and resource utilization (CPU, memory) within the application itself. Tools like Application Performance Monitoring (APM) solutions are essential.
Infrastructure Monitoring: This focuses on the underlying infrastructure, including servers, virtual machines, databases, storage, and networks. Key metrics include CPU usage, memory consumption, disk space, network bandwidth, and latency. Cloud providers’ monitoring services (AWS CloudWatch, Azure Monitor, Google Cloud Monitoring) and tools like Prometheus and Nagios are often used.
Network Monitoring: This monitors network performance, including bandwidth utilization, latency, packet loss, and jitter. Tools such as SolarWinds, PRTG, and specialized network monitoring tools are typically used.
In a recent project, we integrated APM, infrastructure, and network monitoring tools to provide a holistic view of our system’s health. This allowed us to quickly identify the root cause of performance issues, even those spanning multiple layers of the infrastructure.
Q 12. How do you ensure data security and privacy in your monitoring system?
Data security and privacy are paramount in cloud monitoring. My approach prioritizes these aspects:
Data encryption: Employing encryption both in transit (using HTTPS/TLS) and at rest (encrypting data stored in databases or cloud storage). This safeguards sensitive data from unauthorized access.
Access control: Implementing strict access control mechanisms, using role-based access control (RBAC) to restrict access to monitoring data based on user roles and responsibilities.
Data anonymization: Anonymizing or masking sensitive data elements, such as personally identifiable information (PII), in monitoring logs or dashboards to comply with privacy regulations.
Regular security audits: Conducting regular security audits and penetration testing to identify and address vulnerabilities in the monitoring system.
Compliance with regulations: Adhering to relevant data privacy regulations, such as GDPR, CCPA, and HIPAA, depending on the nature of the monitored data and the industry.
Secure logging and auditing: Implementing secure logging practices and auditing mechanisms to track data access and changes.
For example, I implemented a system to anonymize user IDs in our application logs before they were stored in our cloud monitoring solution, ensuring compliance with privacy regulations while maintaining useful performance data.
Q 13. What are some common challenges in cloud monitoring, and how have you overcome them?
Cloud monitoring presents several challenges:
Data volume and complexity: Cloud environments generate massive volumes of data from diverse sources, making data analysis and interpretation challenging. We address this by using efficient data aggregation and filtering techniques.
Cost optimization: Cloud monitoring can be expensive. We address this by optimizing resource utilization and leveraging cost-effective monitoring solutions.
Alert fatigue: Excessive alerts can overwhelm operations teams. We mitigate this by defining clear alert thresholds, implementing intelligent alerting rules, and using advanced alert management systems.
Integration challenges: Integrating different monitoring tools and services can be complex. We address this with careful planning and using standardized APIs and data formats.
Distributed nature of cloud environments: Monitoring distributed systems across multiple availability zones or regions introduces complexity. We utilize distributed monitoring systems that can handle this efficiently.
I’ve overcome these challenges by utilizing efficient data processing techniques, establishing clear alerting strategies, and implementing robust integration pipelines between our various monitoring tools and cloud environments. For example, to address alert fatigue, I implemented a system to aggregate related alerts and deduplicate similar events, reducing the number of notifications sent to the operations team.
Q 14. Explain your experience with automated monitoring and alerting.
Automated monitoring and alerting are essential for efficient cloud operations. My experience includes designing and implementing:
Automated metric collection: Utilizing agents and APIs to automatically collect metrics from various sources, ensuring continuous monitoring without manual intervention.
Automated alerting: Setting up automated alerts triggered by predefined thresholds or anomalies in metrics. These alerts are routed to the appropriate teams via email, SMS, or collaboration tools.
Automated scaling: Automating the scaling of resources based on monitored metrics, ensuring optimal resource utilization and performance.
Automated incident response: Integrating monitoring data with incident management systems to automatically trigger incident response workflows when issues are detected.
Custom scripts and automation tools: Developing custom scripts or using automation tools (e.g., Ansible, Chef) to automate repetitive monitoring tasks and reduce manual effort.
For example, I developed an automated system that scales our application servers based on CPU utilization, ensuring optimal performance and cost efficiency. This system includes automated alerts that notify the team if the scaling process encounters errors or if resource utilization remains unexpectedly high even after scaling.
Q 15. How do you integrate monitoring data with other systems (e.g., incident management, ITSM)?
Integrating monitoring data with other systems like incident management and ITSM tools is crucial for effective DevOps. This integration allows for automated responses to alerts, streamlined workflows, and improved overall efficiency. It’s essentially about creating a closed-loop system where monitoring triggers actions in other systems.
Here’s how I typically achieve this:
- API Integrations: Most modern monitoring tools and ITSM platforms (like ServiceNow, Jira, or PagerDuty) offer robust APIs. I use these APIs to create custom integrations, sending alerts, metrics, and event data from my monitoring system to the ITSM or incident management system. For instance, a critical CPU usage alert in CloudWatch (AWS) might automatically create a ticket in Jira and assign it to the appropriate team.
- Webhook Integrations: Webhooks provide a simple mechanism for real-time data transfer. When a threshold is breached in my monitoring system, a webhook can be triggered, sending a notification to the other system. This is especially useful for faster incident response.
- Change Management Systems: Integration with CMDB (Configuration Management Database) tools is important. This allows for context-rich alerts; knowing precisely what resource is impacted. A change in the CMDB can even trigger proactive monitoring adjustments.
- Alerting and Notification Systems: Leveraging the alerting capabilities within the monitoring tools, we can configure notifications to be sent to various channels (email, Slack, SMS) and integrated directly with the incident management platform to ensure that the right people are notified immediately.
For example, I’ve worked on a project where we integrated Prometheus and Grafana (open-source monitoring tools) with PagerDuty. When Prometheus detected a significant spike in latency, it triggered an alert in PagerDuty, automatically creating an incident and notifying the on-call team. This reduced our Mean Time To Resolution (MTTR) significantly.
Career Expert Tips:
- Ace those interviews! Prepare effectively by reviewing the Top 50 Most Common Interview Questions on ResumeGemini.
- Navigate your job search with confidence! Explore a wide range of Career Tips on ResumeGemini. Learn about common challenges and recommendations to overcome them.
- Craft the perfect resume! Master the Art of Resume Writing with ResumeGemini’s guide. Showcase your unique qualifications and achievements effectively.
- Don’t miss out on holiday savings! Build your dream resume with ResumeGemini’s ATS optimized templates.
Q 16. Describe your experience with different cloud providers (e.g., AWS, Azure, GCP) and their monitoring services.
I have extensive experience with AWS, Azure, and GCP, having designed and implemented monitoring solutions on all three platforms. Each provider offers unique strengths, and the choice often depends on existing infrastructure and specific needs.
- AWS: I’ve extensively used Amazon CloudWatch, a comprehensive monitoring service offering metrics, logs, and tracing. CloudWatch integrates seamlessly with other AWS services, making it a convenient choice for AWS-centric environments. I’ve also leveraged other services like X-Ray for application performance monitoring and Amazon Detective for security insights.
- Azure: Azure Monitor is Azure’s equivalent to CloudWatch. I’ve utilized its capabilities for collecting metrics, logs, and tracing data from various Azure services. Azure’s integration with Log Analytics and Application Insights makes it a robust solution for application performance and security monitoring. I find the integration with other Azure services quite smooth and intuitive.
- GCP: Google Cloud Monitoring offers similar functionalities to AWS and Azure. I’ve worked with Cloud Monitoring, Cloud Logging, and Cloud Trace to monitor Google Cloud Platform resources. The integration with other GCP services is also well-defined, and I’ve particularly appreciated its strong focus on data analytics and visualization via dashboards.
The key differences often lie in the specific features, pricing models, and integration with other services within each ecosystem. My approach involves carefully evaluating the specific requirements of each project before selecting a provider and its monitoring services.
Q 17. How do you use monitoring data to identify and resolve security vulnerabilities?
Monitoring data plays a critical role in identifying and resolving security vulnerabilities. By analyzing logs, metrics, and security events, we can detect suspicious activity and proactively mitigate potential threats.
- Log Analysis: I regularly analyze security logs to detect unusual patterns. This might involve searching for failed login attempts, unauthorized access, or malware activity. Using tools like Splunk, ELK stack, or the native log analytics features of cloud providers helps in this process.
- Metric Monitoring: Unexpected spikes in network traffic or resource utilization can indicate a security breach. Continuous monitoring of these metrics allows for early detection of such anomalies.
- Security Information and Event Management (SIEM): SIEM systems aggregate and analyze security data from multiple sources, providing a centralized view of security events. This helps in correlating events and identifying sophisticated attacks that might be missed by individual monitoring tools.
- Vulnerability Scanning: Integrating vulnerability scanners into the monitoring pipeline ensures regular assessments of the security posture of the environment. Tools like Nessus or Qualys can identify vulnerabilities and trigger alerts when critical issues are detected.
- Intrusion Detection Systems (IDS) and Intrusion Prevention Systems (IPS): These systems analyze network traffic to detect and prevent malicious activities. Their logs are essential components of comprehensive security monitoring.
For example, I once detected a DDoS attack on a web application by monitoring the network traffic metrics. The sudden spike in requests from various IP addresses triggered an alert, allowing us to quickly implement mitigation strategies.
Q 18. Explain your experience with container monitoring (e.g., Docker, Kubernetes).
Container monitoring presents unique challenges due to their dynamic and ephemeral nature. Effective container monitoring requires a different approach than traditional virtual machine monitoring.
- Container Runtime Metrics: I use tools like cAdvisor (for Docker) or the built-in metrics collection of Kubernetes to monitor container resource utilization (CPU, memory, network I/O). These provide insights into individual container health.
- Kubernetes-Specific Monitoring: For Kubernetes deployments, I leverage tools like Prometheus and Grafana, which can monitor the Kubernetes cluster itself (node health, pod status, etc.) along with the applications running inside the containers. Tools like kube-state-metrics provide vital metrics for the Kubernetes ecosystem.
- Distributed Tracing: For microservices architectures deployed in containers, distributed tracing is essential for tracking requests across multiple containers and services. Tools like Jaeger or Zipkin help identify performance bottlenecks and issues that span multiple containers.
- Logging and Log Aggregation: Centralized log aggregation is critical for debugging and troubleshooting containerized applications. Tools like the ELK stack or Fluentd are commonly used for collecting and analyzing logs from various containers.
In a recent project, we used Prometheus and Grafana to monitor a Kubernetes cluster hosting microservices. This allowed us to identify a memory leak in one of the containers, which was impacting the overall performance of the application. The monitoring data pinpointed the faulty container, enabling quick remediation.
Q 19. How do you ensure the accuracy and reliability of your monitoring data?
Ensuring the accuracy and reliability of monitoring data is paramount. Inaccurate data can lead to misinterpretations, delayed responses to incidents, and poor decision-making.
- Data Validation: I implement data validation checks at various stages of the monitoring pipeline. This might involve verifying the correctness of metrics, checking for data inconsistencies, and filtering out noisy data.
- Data Redundancy and High Availability: Designing monitoring systems with redundancy ensures data availability even in case of failures. This often involves using multiple monitoring agents and storing data in multiple locations.
- Regular Calibration and Verification: I regularly calibrate monitoring agents and verify the accuracy of data collected. This might involve comparing monitoring data with other sources or conducting manual checks.
- Alert Threshold Tuning: Setting appropriate alert thresholds is crucial to avoid alert fatigue and ensure that only meaningful alerts are triggered. This requires careful analysis of historical data and a good understanding of the system being monitored.
- Monitoring the Monitoring System: It’s important to monitor the health and performance of the monitoring system itself. If the monitoring system fails, we lose visibility into our application and infrastructure.
Imagine a scenario where a faulty sensor is sending inaccurate temperature readings. Without proper data validation, this could trigger unnecessary alerts or even lead to a misdiagnosis of a problem. Implementing robust data validation and verification processes helps prevent such scenarios.
Q 20. Describe your experience with using monitoring data to improve application performance.
Monitoring data is invaluable for improving application performance. By analyzing metrics and logs, we can identify bottlenecks, optimize resource utilization, and enhance the overall user experience.
- Performance Bottleneck Identification: Analyzing response times, CPU usage, memory consumption, and network I/O helps pinpoint performance bottlenecks. Tools like application performance monitoring (APM) systems provide detailed insights into application performance.
- Resource Optimization: Monitoring data can guide resource allocation decisions. By understanding resource utilization patterns, we can optimize resource allocation to improve performance and reduce costs.
- Capacity Planning: Monitoring data helps predict future resource needs. Analyzing historical trends in resource utilization allows for proactive capacity planning, preventing performance degradation due to resource exhaustion.
- Code Optimization: Profiling tools and performance monitoring data can help identify code sections that need optimization. This can involve optimizing algorithms, improving database queries, or refactoring code to enhance performance.
For example, in a recent project, we used APM data to identify a slow database query that was impacting the overall performance of the application. By optimizing the query, we reduced response times significantly and improved the user experience.
Q 21. What are some best practices for designing and implementing a cloud monitoring strategy?
Designing and implementing a robust cloud monitoring strategy requires careful planning and execution. Here are some best practices:
- Define Clear Objectives: Start by defining the specific goals of your monitoring strategy. What do you want to achieve with monitoring? Improved uptime? Faster incident response? Reduced costs? Clear objectives guide your decisions.
- Identify Key Metrics: Determine the key metrics that will be monitored. These should align with your objectives. Consider metrics related to application performance, infrastructure health, security, and business outcomes.
- Choose the Right Tools: Select monitoring tools that meet your specific needs and integrate well with your existing infrastructure. Consider factors like scalability, cost, ease of use, and feature set.
- Establish Alerting Policies: Define clear alerting policies to ensure that you are notified only of significant events. Avoid alert fatigue by carefully setting thresholds and prioritizing alerts.
- Implement Automated Responses: Automate responses to alerts whenever possible. This can include automatically scaling resources, restarting failed services, or notifying the appropriate teams.
- Regularly Review and Improve: Monitoring is an ongoing process. Regularly review your monitoring strategy, analyze the data collected, and make adjustments as needed. Adapt your strategy as your infrastructure and applications evolve.
- Data Security and Privacy: Implement appropriate security measures to protect your monitoring data. Consider data encryption, access control, and compliance with relevant regulations.
A well-defined monitoring strategy, coupled with proactive monitoring and automated responses, ensures quick identification and resolution of issues, leading to improved system reliability and business continuity.
Q 22. How do you handle high-volume alerts and prevent alert fatigue?
High-volume alerts, a common problem in cloud monitoring, lead to alert fatigue, where engineers become desensitized and miss critical issues. The key is to move from reactive to proactive monitoring and intelligent alert management.
- Alert Threshold Optimization: Carefully configure alert thresholds. Avoid overly sensitive thresholds that trigger alerts for minor fluctuations. Instead, focus on significant deviations from established baselines or critical performance metrics. For example, instead of alerting on CPU usage above 70%, consider setting the threshold to 90% and adding a duration requirement (e.g., sustained for 15 minutes). This reduces noise significantly.
- Alert Correlation and Grouping: Modern monitoring tools often allow for correlating alerts. If multiple related alerts trigger simultaneously (e.g., high CPU, high memory, and slow response times), group them into a single, higher-level alert. This reduces the number of alerts while providing a more comprehensive view of the problem.
- Alert Filtering and Suppression: Implement mechanisms to filter out predictable events, such as scheduled maintenance periods. Alert suppression allows temporarily silencing alerts for known events, reducing unnecessary notifications. This requires careful planning to ensure critical alerts are not accidentally suppressed.
- Automated Remediation: For routine problems, automate responses. Auto-scaling, self-healing systems, and automated restarts can mitigate many issues before they generate alerts, or even automatically resolve them before the engineer is notified.
- Alert Routing and Prioritization: Route alerts based on severity and team responsibility. Use different communication channels (e.g., email for low severity, pager duty for critical alerts) to optimize response time. Implement an escalation policy to ensure timely handling of critical issues.
By strategically implementing these techniques, you can significantly reduce alert fatigue and improve the effectiveness of your monitoring system.
Q 23. Explain your understanding of different monitoring approaches (e.g., push vs. pull).
Cloud monitoring employs both push and pull approaches, each with its strengths and weaknesses.
- Pull Monitoring: In this approach, your monitoring system periodically queries your cloud infrastructure for its metrics and status. Think of it like checking your email – you actively retrieve information. Examples include using the AWS CloudWatch API to retrieve metrics or using a monitoring tool that periodically polls your systems. This method is typically less demanding on your cloud environment because it doesn’t require constant outbound connections. However, it introduces latency as you are not instantly aware of changes.
- Push Monitoring: With push monitoring, your cloud infrastructure actively sends metrics and alerts to your monitoring system as changes occur. This is like receiving an instant notification whenever something happens – your infrastructure pushes the information to your system. This approach offers real-time monitoring, allowing faster detection of issues. However, it puts a larger load on your infrastructure and network, since it requires a constant connection between the monitored systems and the monitoring system.
Many modern monitoring systems use a hybrid approach, leveraging both push and pull mechanisms to get the benefits of both approaches. They might use push for critical alerts and pull for less time-sensitive metrics, creating an efficient and responsive monitoring strategy. The choice depends on the application’s criticality, the acceptable latency in detecting issues, and the available resources.
Q 24. How do you measure the effectiveness of your cloud monitoring system?
Measuring the effectiveness of a cloud monitoring system requires a multi-faceted approach. It’s not simply about the number of alerts, but about how efficiently it identifies and helps resolve problems.
- Mean Time to Detect (MTTD): This metric measures the average time it takes to detect an issue. A lower MTTD is better, indicating a quicker response to problems.
- Mean Time to Resolve (MTTR): This indicates the average time taken to resolve an issue. Similar to MTTD, a lower MTTR is more efficient and desirable.
- Alert Accuracy: Track the percentage of alerts that accurately reflect genuine issues versus false positives. A high accuracy rate demonstrates the system’s precision.
- Uptime and Availability: Monitor the overall uptime and availability of your applications and services. The effectiveness of the monitoring system is directly linked to its ability to maintain this uptime.
- User Satisfaction (Internal): Gather feedback from operations and development teams on the usability and effectiveness of the alerts and monitoring dashboards.
By tracking these metrics over time, you can identify areas for improvement and demonstrate the effectiveness of your cloud monitoring setup. For example, a high MTTD might indicate a need for more proactive monitoring strategies or improved alert configuration. A high rate of false positives implies a need for adjustment of alert thresholds or improved filtering rules.
Q 25. Describe a situation where you had to troubleshoot a complex monitoring issue.
During a recent migration to a new cloud provider, we experienced intermittent application slowdowns that were not initially detected by our standard monitoring tools. Our initial dashboards showed no obvious CPU or memory issues. This was a classic case where relying solely on metrics didn’t give the complete picture. The issue was buried within the network layer.
Our troubleshooting involved the following steps:
- Detailed Log Analysis: We shifted our focus to detailed log analysis, looking for patterns within application and infrastructure logs.
- Network Monitoring Tools: We utilized specialized network monitoring tools to identify bottlenecks and latency issues in the network traffic between different components of the application.
- Synthetic Monitoring: To isolate the problem, we used synthetic transactions to test the application’s response times from different geographical locations. The inconsistencies highlighted issues in the network routing.
- Collaboration and Root Cause Analysis: We collaborated with the cloud provider’s support team to review network configurations and traffic patterns.
The root cause turned out to be an improperly configured network security group (NSG) that was intermittently blocking traffic to specific application components. Correcting the NSG configuration resolved the issue. This experience highlighted the importance of a comprehensive monitoring strategy, incorporating various techniques and tools to capture a complete picture, and the value of collaboration during complex troubleshooting.
Q 26. What are your preferred methods for visualizing monitoring data?
Effective visualization of monitoring data is crucial for quick understanding and problem identification. My preferred methods prioritize clarity, conciseness, and customization.
- Dashboards with Customizable Views: I prefer dashboards that provide an at-a-glance view of key metrics, with the ability to customize the displayed information and widgets based on specific roles and needs. Pre-built dashboards are good starting points, but often need tailoring.
- Interactive Charts and Graphs: Line graphs for trends, bar charts for comparisons, and heatmaps for identifying patterns are very useful, particularly when they’re interactive and allow for zooming, filtering, and drill-down capabilities.
- Geographic Maps for Distributed Systems: For monitoring geographically distributed systems, geographic maps that visually represent the health and performance of different regions are very effective in spotting regional issues.
- Customizable Alerts and Notifications: These should be tailored to be relevant and focused so that they don’t get lost in the noise. They are only useful if easily distinguishable.
The key is to avoid overwhelming the user with too much information. Data visualization should highlight critical insights and facilitate timely actions. A well-designed visualization can drastically reduce the time it takes to understand the state of the system and pinpoint potential problems.
Q 27. How do you stay up-to-date with the latest trends and technologies in cloud monitoring?
Staying current in the rapidly evolving field of cloud monitoring requires a multi-pronged approach.
- Industry Publications and Blogs: Regularly reading blogs, articles, and white papers from industry leaders (such as AWS, Azure, GCP, and independent experts) keeps me abreast of new tools and best practices.
- Conferences and Webinars: Attending industry conferences and webinars provides invaluable insights into emerging trends and technologies, often involving direct engagement with developers and thought leaders.
- Online Courses and Certifications: Online platforms offer a wealth of training materials and certifications to deepen my knowledge in cloud monitoring and related technologies. These provide practical hands-on experience.
- Open-Source Projects and Communities: Following and contributing to open-source projects related to monitoring and observability allows me to learn from others and engage in peer-to-peer knowledge sharing.
- Following Thought Leaders on Social Media: Monitoring relevant discussions on social media platforms like Twitter and LinkedIn helps stay up-to-date with the latest developments and breakthroughs.
By consistently engaging in these methods, I ensure I remain proficient in cloud monitoring best practices and am aware of the newest techniques and technologies available.
Q 28. Describe your experience with using synthetic monitoring to proactively identify issues.
Synthetic monitoring is invaluable for proactively identifying issues before they impact real users. It involves simulating user interactions with your application or service to assess its performance and availability. Rather than just passively monitoring existing traffic, you actively probe the system.
My experience includes using synthetic monitoring to:
- Identify network connectivity problems: Synthetic monitors placed in various geographic locations allowed us to pinpoint slowdowns caused by network latency or outages before real users reported the issue.
- Detect application performance degradations: Simulating user transactions allowed us to identify performance regressions before they impacted end-users. This allowed for proactive resolution instead of just responding to user complaints.
- Validate new deployments: Before releasing new versions of our applications, we employed synthetic monitors to verify the performance and functionality of the update in a controlled environment. This helps catch problems early, avoiding production issues.
- Test application resilience: By simulating high traffic loads or failures, synthetic monitoring helped identify bottlenecks and ensure the application’s resilience to unexpected spikes and outages. This is crucial for maintaining high availability.
Synthetic monitoring is a powerful tool to shift monitoring from a reactive to a proactive approach. By simulating realistic user scenarios, it allows you to identify and resolve potential issues before they affect end-users, leading to improved user experience and reduced downtime.
Key Topics to Learn for Cloud Monitoring Interview
- Cloud Monitoring Fundamentals: Understanding the core principles of cloud monitoring, including metrics, logs, and traces. This includes defining key performance indicators (KPIs) and Service Level Indicators (SLIs).
- Monitoring Tools and Technologies: Gain practical experience with popular cloud monitoring tools like Prometheus, Grafana, Datadog, CloudWatch, or similar platforms. Understand their functionalities and how to effectively utilize them.
- Alerting and Notifications: Designing and implementing robust alerting systems to proactively identify and respond to critical issues. This includes understanding different alerting thresholds and methods.
- Data Analysis and Visualization: Mastering the art of interpreting monitoring data to identify trends, anomalies, and potential problems. Practice visualizing this data effectively through dashboards and reports.
- Distributed Tracing and Observability: Learn about distributed tracing techniques to understand the flow of requests across multiple services and microservices. Understand the concepts of observability and its relation to monitoring.
- Security Considerations in Cloud Monitoring: Addressing security best practices related to data access, authentication, and authorization within your monitoring infrastructure.
- Troubleshooting and Problem Solving: Develop your ability to diagnose and resolve complex issues using monitoring data. Practice identifying root causes and implementing effective solutions.
- Cost Optimization Strategies: Understand how to optimize cloud monitoring costs while maintaining effective coverage and performance.
Next Steps
Mastering Cloud Monitoring is crucial for career advancement in today’s cloud-centric world. It demonstrates a high level of technical expertise and problem-solving skills highly valued by employers. To increase your chances of landing your dream job, focus on crafting a strong, ATS-friendly resume that highlights your skills and experience. We recommend using ResumeGemini to build a professional and impactful resume. ResumeGemini offers a streamlined process and provides examples of resumes tailored to Cloud Monitoring roles to help guide you.
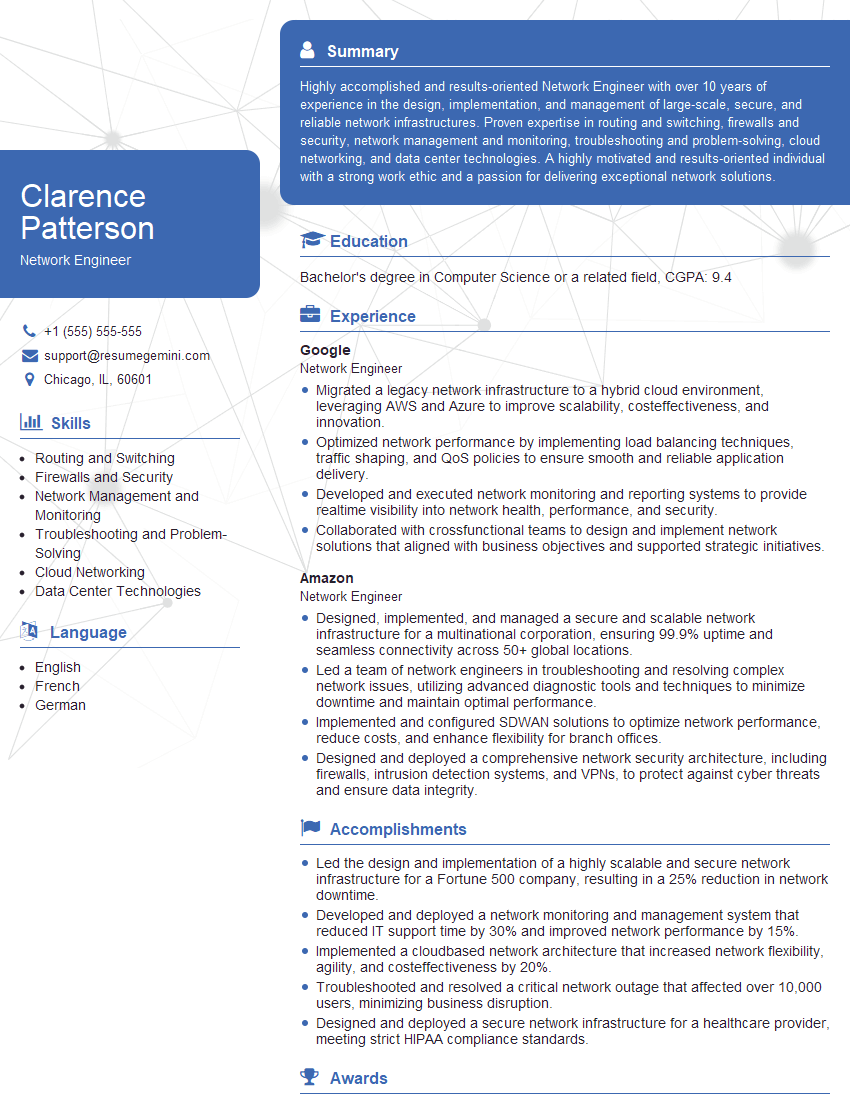
Network Engineer Resume Sample
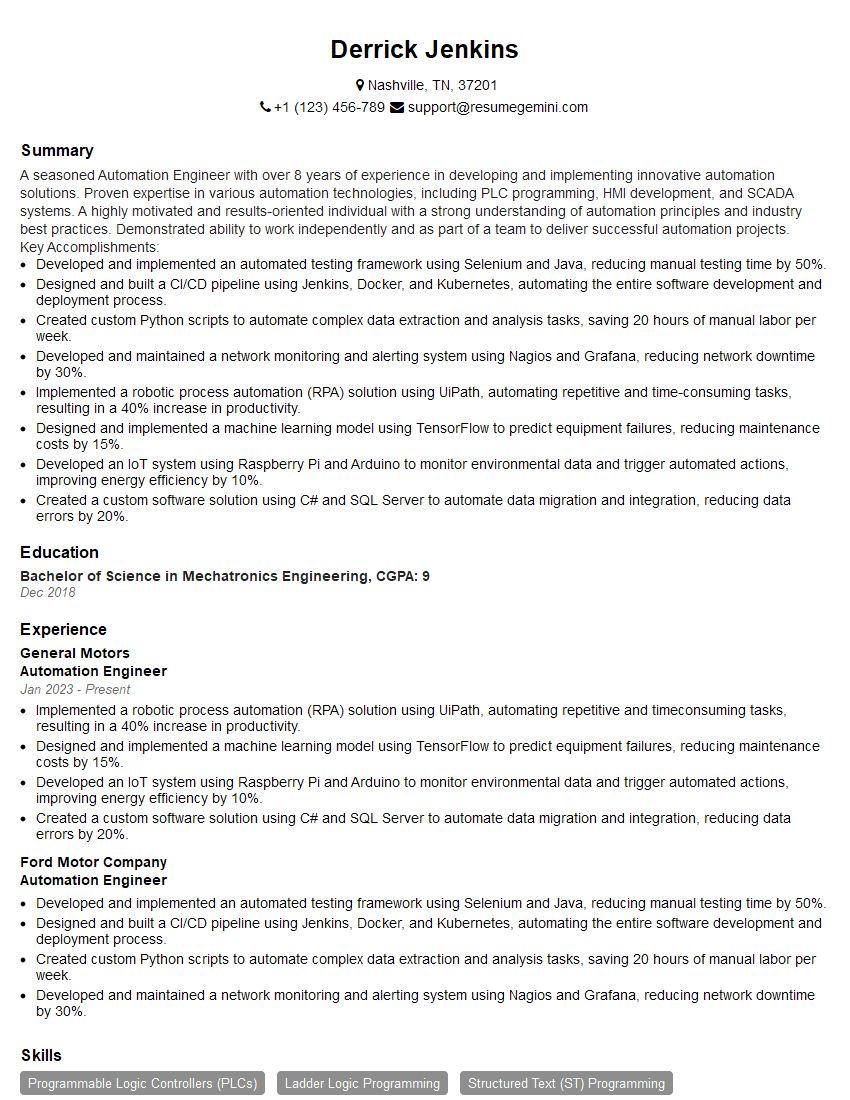
Automation Engineer Resume Sample
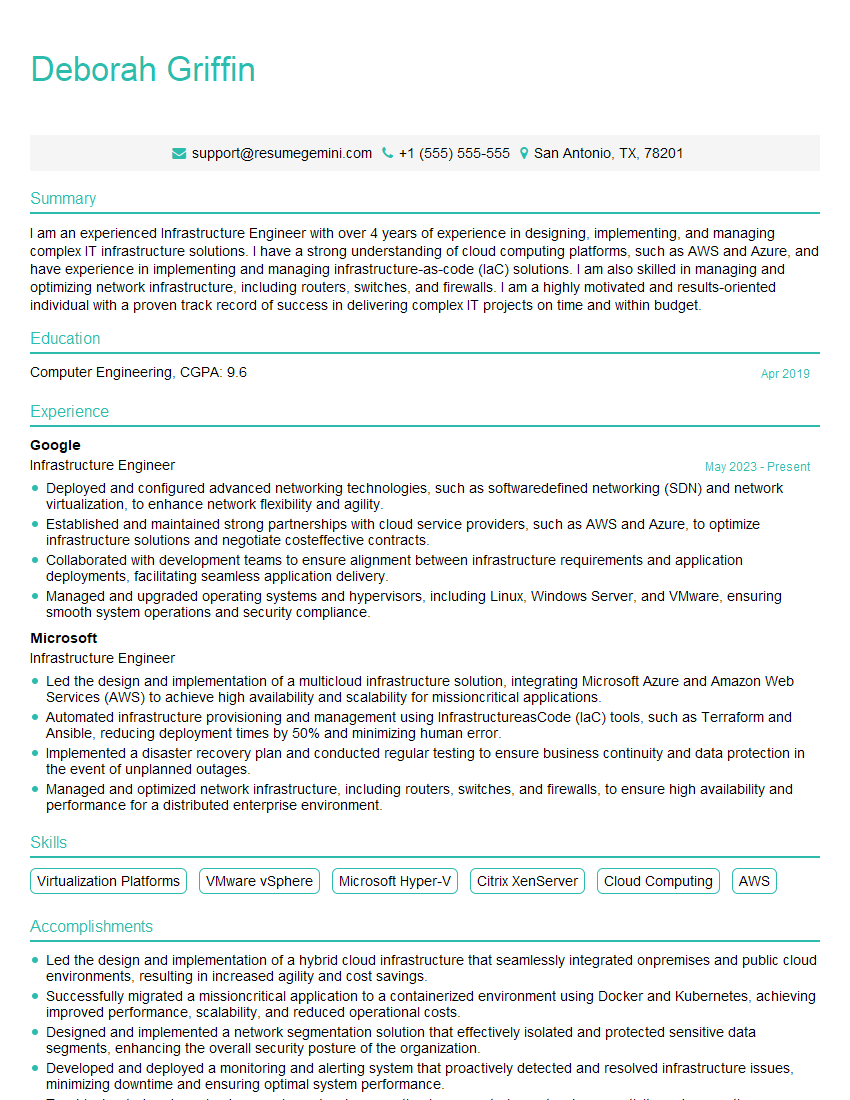
Infrastructure Engineer Resume Sample
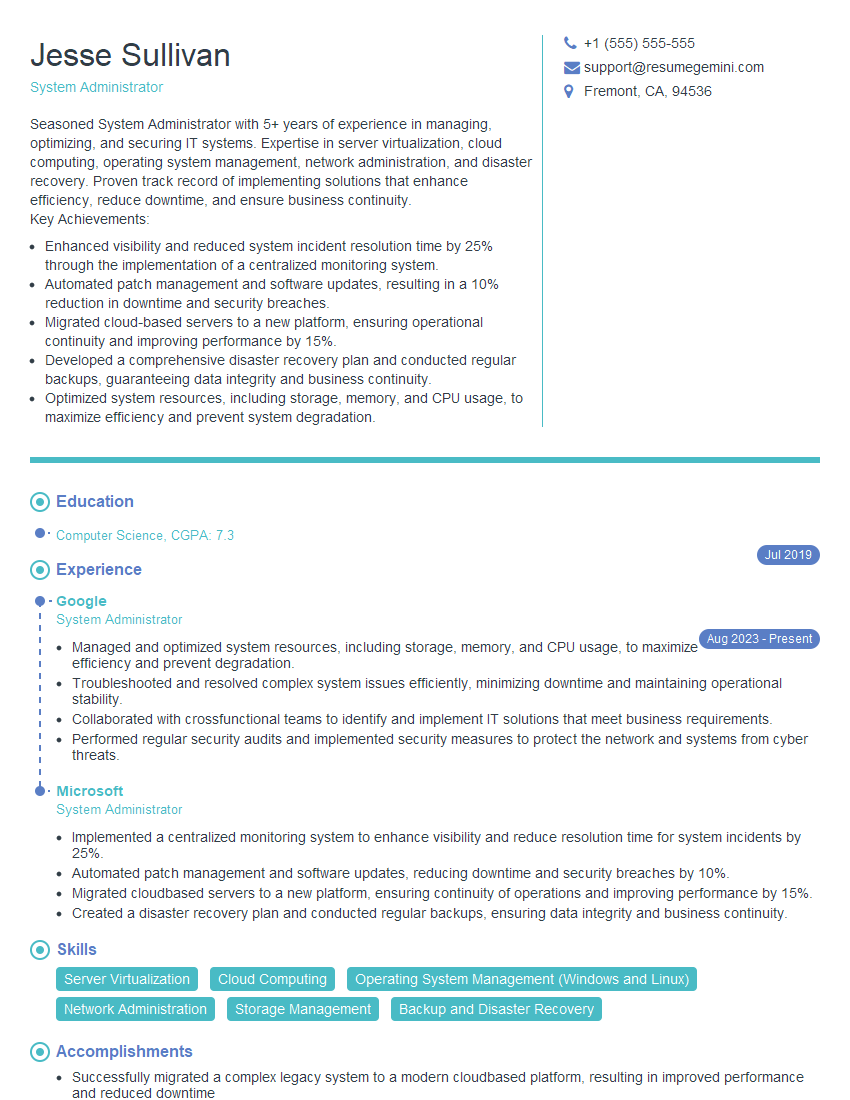
System Administrator Resume Sample
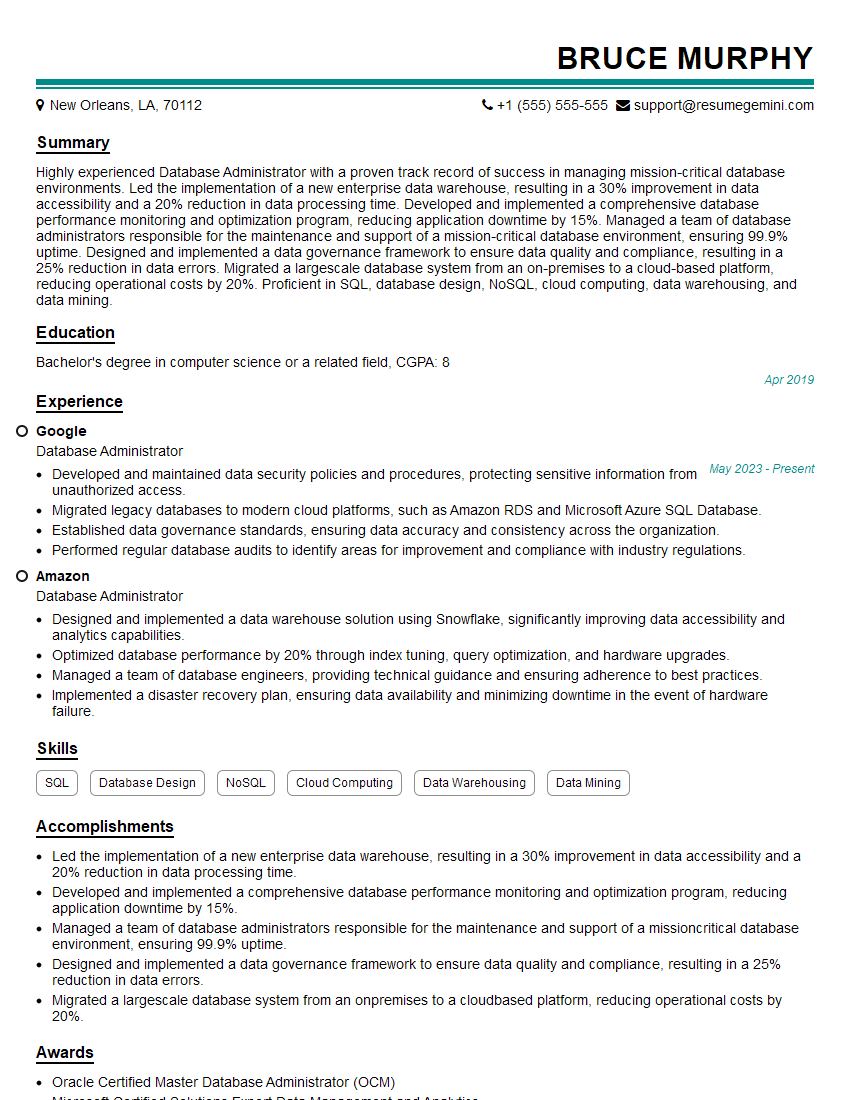
Database Administrator Resume Sample
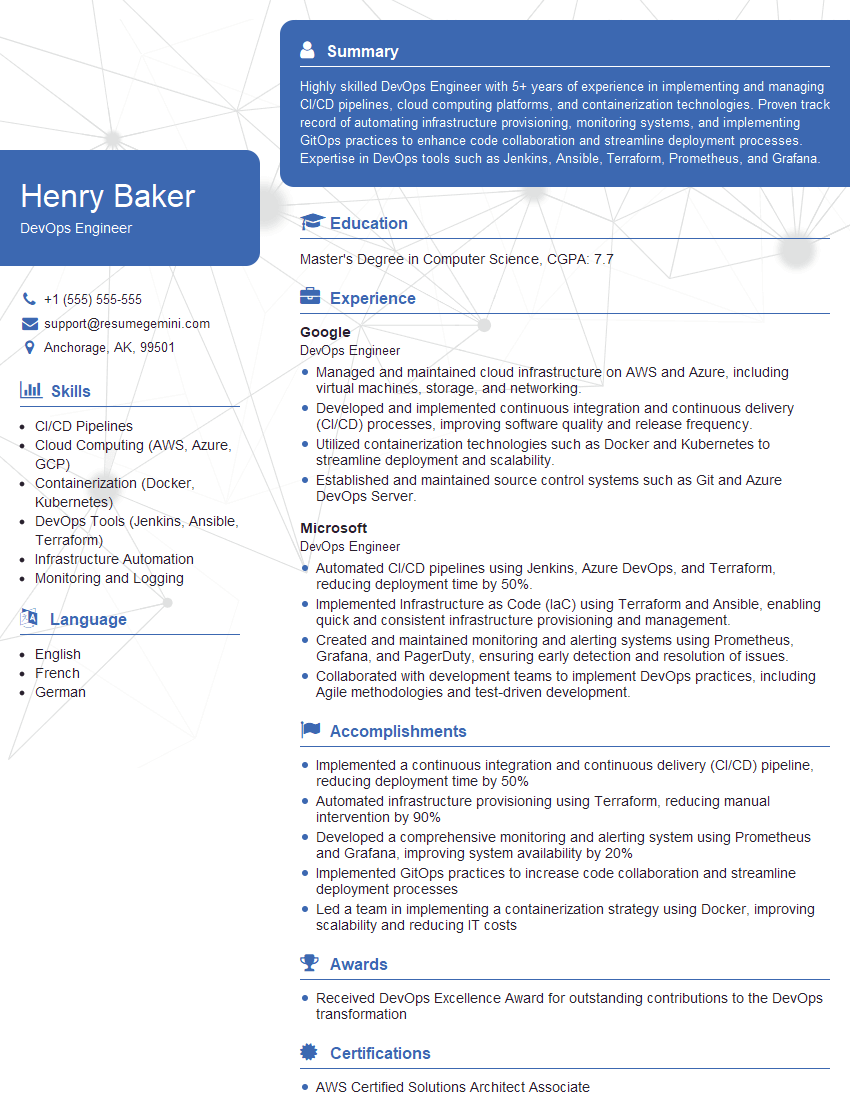
DevOps Engineer Resume Sample
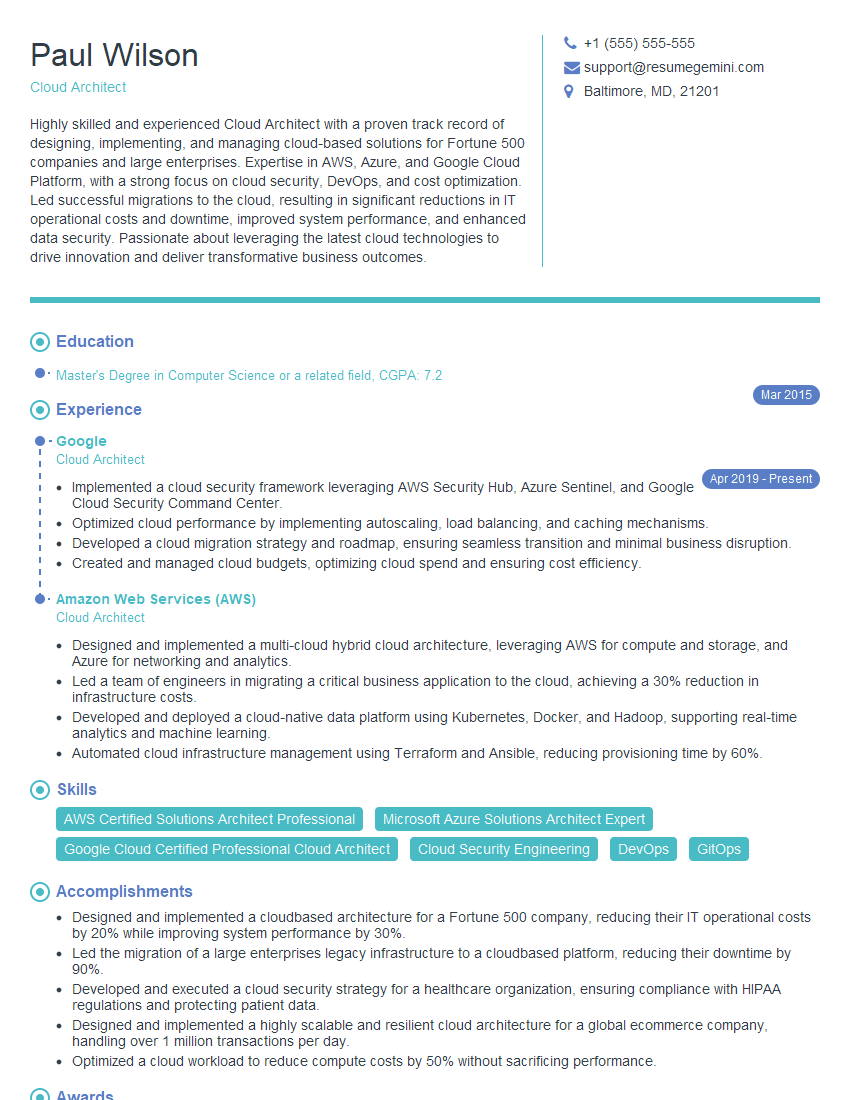
Cloud Architect Resume Sample
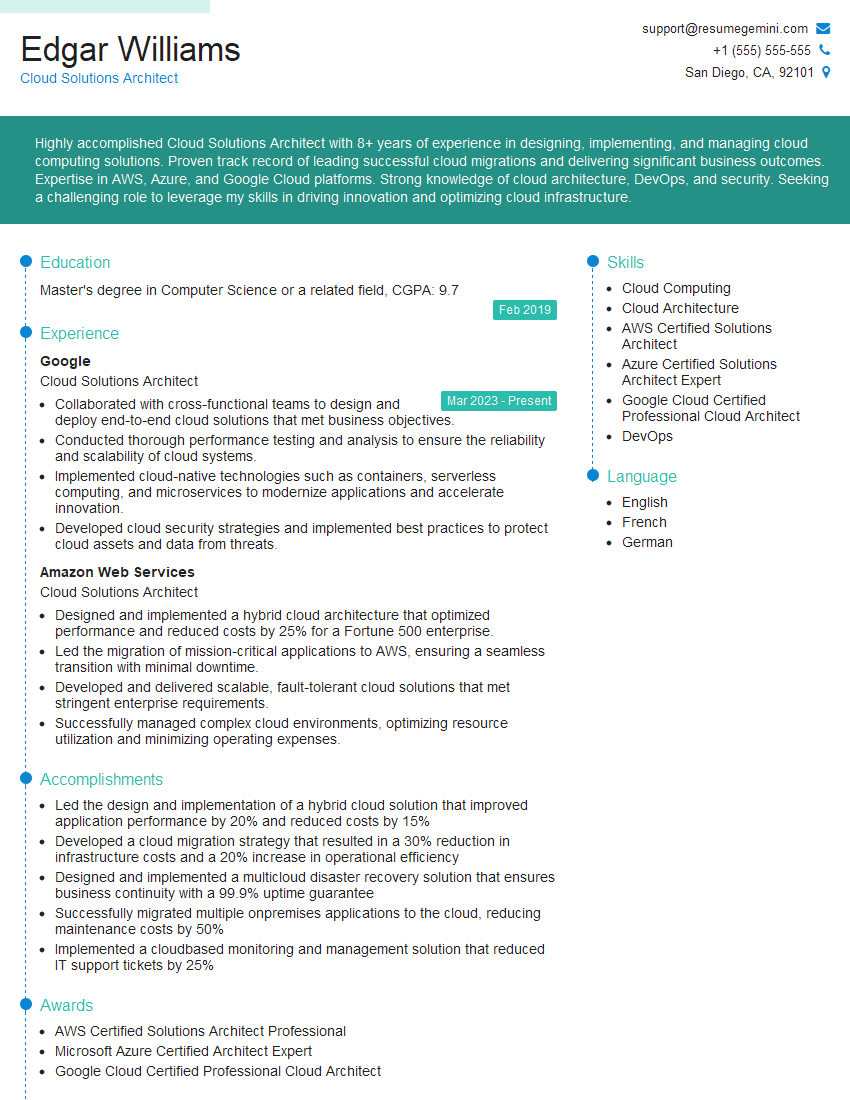
Cloud Solutions Architect Resume Sample
Cloud Security Engineer Resume Sample
Explore more articles
Users Rating of Our Blogs
Share Your Experience
We value your feedback! Please rate our content and share your thoughts (optional).
What Readers Say About Our Blog
Really detailed insights and content, thank you for writing this detailed article.
IT gave me an insight and words to use and be able to think of examples